Nationals Arm Race

"… the reason you win or lose is darn near always the same – pitching.” — Earl Weaver

Archive for the ‘Baseball in General’ Category

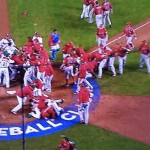
WBC First Round Review

5 comments

I have to admit: I’m much more interested in the World Baseball Classic this year than in the first two iterations.  I don’t know why; perhaps its because I’ve become much more interested in prospects over the past few years, and the WBC rosters for the lesser teams are filled with minor league prospects.  I’m definitely watching the games though and have been really enjoying the competitions.  Here’s a quick review of the first rounds in all the pools (note that in the Far East the 2nd round is well underway; we’ll talk about that in a subsequent post).

These Pools are listed in their order of finish.  Here’s a Fangraphs.com summary of the two Far East pool first rounds.  And here’s the overall bracket for the tournament.

Pool A: Cuba, Japan, China, Brazil.

No real surprises here: the Brazilian team was expected to finish dead last while international powerhouse Cuba and two-time defending champion Japan advanced relatively easily.   Cuba continues its stellar international record with a head-to-head win against Japan to win the group (and as discussed here previously, could be a juggernaut if the defected Cubans could participate as well).  The bigger surprise here was China beating out Brazil for the automatic spot in the 2017 classic.

Pool B: Chinese Taipei, Netherlands, South Korea, Australia

A rather big upset here: South Korea finished 3rd and 2nd in the first two WBC tournaments, but fell behind the Netherlands on Run Differential after all three teams finished pool play 2-1.  Some have complained about the seedings; clearly by the results of the first two WBC events putting South Korea, Cuba and Japan in the same bracket seems unfair.  The Netherlands is filled with players from baseball-playing Dutch colonies such as the Netherlands Antilles, Curacao and Aruba, though it also has a number of players from the Dutch professional league Honkbal Hoofdklasse; either way it was not expected to advance against a traditionally strong Korean team playing so close to home.  Former Nat Chien-Ming Wang pitched well for Taiwan, bolstering his attempts to make a comeback after several disappointing seasons with Washington.  Our own Roger Bernadina started and played well for the Netherlands as they played their way into the 2nd round.

Pool C: Dominican Republic, Puerto Rico, Venezuela, Spain

There was no surprise who came in dead last (Spain), but I for one was shocked that a stacked Venezuelan lineup couldn’t come out on top of the Puerto Rican team.  Meanwhile the starting lineup for the D.R. looked closer to a MLB all-star lineup, and their dominance showed.  They’ve under-achieved in every tournament thus far and I look for the D.R. to go far in this tournament.  It was nice to see former Nats farm hand and prospect-watching favorite Christopher Manno pitching for Spain, even if he didn’t fare that well.

Pool D: USA, Italy, Canada, Mexico

For a while on Sunday, it looked like the USA was closer to finishing dead last (and having to qualify for the next tournament) than winning it, but that’s the surprises involved in pool play.  After getting completely out-played by Mexico in the opener, the USA squeaked by Italy on the strength of 4 scoreless, nearly flawless innings from Ross Detwiler before turning it on late to beat Canada.  Meanwhile, the “Italian” team (I put that in quotes since i’d challenge someone to find more than a handful of the Italian team that actually speaks the language) surprises everyone by finishing second.  Meanwhile, Mexico finishes dead last behind a surprisingly good Canadian team (whose 3-4-5 hitters batted something like .450 for the tournament) and faces qualification for the next tournament.  An interesting pool all around, which could have looked very differently with just a few runs here or there.

Brackets for the Semi final rounds (some of which have already started as of the time of this writing):

2nd Round Pool 1: Netherlands v Cuba, Japan v Chinese Taipei

2nd Round Pool 2: Italy v Dominican Republic, USA v Puerto Rico

Pool 1’s favorites have to be Japan and Cuba, while Pool 2’s favorites have to be USA and the Dominican Republic.  But, the Netherlands and Italy have played far above their supposed skill level thus far and we could be in for more shocks.

Written by Todd Boss

March 11th, 2013 at 9:26 am

Why I’d support a Universal DH

12 comments

Yes, I’d like to see more DHs like David Ortiz in the league. Photo wiki/flickr user Toasterb

Every once in a while, during a period of time where there’s a relative dearth of topics I’d like to blog about, I scroll through dozens of draft posts and starter topics I’ve got saved and find one worth expanding on.  And sometimes one of these random drafts written months or years ago suddenly becomes topical because two hard-ass old-school managers decide to one-up each other in a meaningless spring training game.  Further, seeing this random post on Beyond the Box Score, referring to a Joel Sherman article in the NY Post on the topic spurred me into action to dust off this post and put it up for your perusal and criticism.

Summary: Despite mostly considering myself to be a baseball purist, I support going to using full-time Designated Hitter in both leagues.  Here’s a few reasons why:

1. Standardize rules between the leagues.  It is rather ridiculous that in 2013 half of a major US professional sport plays by such vastly different rules than the other half.  It would be as if the NFC in football was forced to attempt 2-point conversions after every touchdown while the AFC forced the use of a point-after attempt instead.

Here’s another interesting observation; i’m pretty sure that the National League is the ONLY baseball league in the country that requires its pitchers to hit.  The DH is in use in the minors, in college ball, in HS and AAU ball, and even in lower-level youth leagues (not that anyone would actually use it down that low, when your pitcher is usually your best hitter).

2. Improve the fan experience. As has been more eloquently stated elsewhere, fans would rather see a power hitter batting in the middle of the order than see a feeble .180-hitting starting pitcher batting 9th flail at a 95mph fastball for the 3rd out of each inning.  Scoring would rise, and more offense means more excitement for the fans.  Forcing pitchers to bat (and, more often than not, bunt) forces managers into a small ball mentality that is counter to most advanced metrics that advocate never trading an out for a base.

3. Let NL fans see more AL Stars in Interleague play.  Related to #2; right now in interleague games AL DH’s mostly have to sit, or if they do play another starter has to sit.  As an NL home city fan when the Red Sox come to town I don’t want to see Jon Lester hit; I want to see David Ortiz hit.

4. Artificially limiting NL Starting Pitchers.  Lack of DH in the NL means that managers are forced to remove starters too early, too often, in order to continue rallies in the middle innings.  I’ve even seen people advocate starters getting yanked in the 2nd or 3rd innings of games in certain situations.  I’d rather see my starter go as long as he can instead of having the one-out matchup styles of some bullpen managers start in the 5th inning of an (inevitably) 4 hour game.

5. More hitters get longer careers as their defensive skills wane.  Right now there’s a number of halfway decent hitters who are older and thus defensive liabilities who have basically been forced out of baseball that could fit in nicely with one of the 15 NL teams that don’t use a DH.  If you don’t think the player’s union wouldn’t mind 15 additional jobs for career-twilight veterans (who are mostly at the upper ends of the pay scales), you’re crazy.  This is essentially why I think the players union would support a universal DH.

6. Double switches juggled lineup spots is overrated.  Purists love it of course, but purists also want baseball to still have the pennant winners immediately advance to the World Series and cringe at divisional play, wild cards and the expanding post-season.  But expanding and increasing popularity of the sport means reaching out and appealing to the masses, and the masses interests are the same as purists.  One of the big reasons purists maintain support for the DH is because of the notion that these double switches and earlier pitcher man management makes for a better managed game and forces NL managers to be “better.”  That’s great and all … but I buy tickets to watch the players play, not to watch some overweight aging manager waddle out to the mound in the 5th inning so he can get a lefty-lefty matchup.

7. NL Teams are at a disadvantage in every inter-league game right now, because they build their rosters for the NL style of play while AL teams are afforded a blank line-up spot for a no-defense slugger all season.  AL teams are also allowed to “rest” players and just bat them over the course of the greuling 162-game schedule by virtue of the DH, while NL players get no such luxury, meaning you can make the argument that AL teams have a slight advantage in the World Series against their NL counterparts (not that we actually see this advantage … but in theory it exists).  You can make the counter-argument that AL pitchers are ill-prepared to bat as compared to their NL counter-parts, to which I’ll say that a .180 hitting pitcher is only slightly better than a .120 hitting pitcher.

8. Interleague every day means that the #7 issue is exacerbated.  This is the gist of the Sherman post; now that Houston is in the AL and there’s 15 teams in each league, there’s inter-league games every day.  Which also means that NL teams are even more disadvantaged since they can no longer do roster-maintenance just ahead of known interleague stretches.  Likewise, AL teams now have to have their pitchers take BP all throughout the season.  Its just a bad strategic situation all around.

9. Pitcher Specialization leading to worse hitting Pitchers.  Related to Point #1 (where the MLB NL is the sole league in America that “forces” pitchers to hit), we’re in the midst of an obvious shift in pitcher specialization, both in the majors (bullpen specialized roles) and during development.  More and more, kids are identified as superb pitchers early in their amateur careers (in many cases early in high school) and literally stop hitting.  At age 15-16.  If you’re a grade-A pitching prospect, do you think you want to jeopardize your draft status or your full-ride by screwing around on the base-paths in some meaningless AAU game?  I think not.  So these kids who havn’t worked on their hitting since their sophomore year in HS then get drafted or go to college, play years of Div-1 or minor league ball, maybe make it to the majors at age 24-25 …. and they havn’t faced live pitching regularly in a decade!  Is that what *anyone* really wants?

10. Baseball needs to spur offense: every one knows that the proliferance of upper 90s bullpen arms and the cracking down on PEDs has inevitably led to less offense in the game.  Joe Sheehan had a fun stat that pointed out that fans in 2014 were less likely to see a “ball put in play” than at any point since the dead ball era, thanks to the massive spike in strikeouts in the game.  Adding a DH and eliminating a position that league-wide bats about .122 would help.

Its time.  End the DH.  I was hoping for a resolution in the last CBA, but we have to wait a bit longer.


post-publishing edit: for context here was the 2019 slash lines for Pitchers in baseball: Here’s the link: Major League Total Stats ” 2019 ” Pitchers ” Dashboard. they slashed a collective .128/.160/.162 with a staggering 43.5% strikeout rate and a -18 wRC+. 43% strikeout rate! Why do baseball fans advocate to keep this, at the same time when they’re probably complaining about … how often baseball players strike out right now. By way of comparison, here’s the DH slash line for 2019: .252/.339/.467 for a wRC+ of 110.

Written by Todd Boss

March 8th, 2013 at 9:12 am

Mike Trout’s 2013 Salary Debate

6 comments

Trout curiously penny-pinched by his team in salary assignment. Photo wiki/flickr Keith Allison

The Los Angeles Angels could have “assigned” any salary they wanted to Mike Trout, per the guidelines set forth by the CBA for pre-arbitration MLB players.  They chose to give Trout a nominal raise ($20k), paying him barely more than the MLB minimum for 2013.

Trout, to his credit, has taken the high road.    Trout’s agent Craig Landis has not, ripping the team for the move, which resulted at the end of a “negotiation” whereby the Angels basically told Landis they were done talking and summarily “assigned” a salary for 2013.

Were the Angels entirely within their right to do this?  Yes.

Is $510,000 an amazing amount of money regardless?  You bet.

Does this number have any effect on the 9-figure salary Trout will eventually merit?  Not in the least.

Did the Angels needlessly look to save a few thousand dollars with the ONE guy on the team who they shouldn’t have low-balled after his historic 2012 season?  Absolutely.

There’s ample precident for teams to pay pre-arb guys more than they need to in order to show good faith.  Just a couple of recent examples: Craig Kimbrel went from $419k to $590k after winning the Rookie of the Year in 2011.  Tim Lincecum went from $405k to $650k after winning the Cy Young.   Grant Brisbee posted a few more 1st-2nd year salary jumps for the last 10 years of Rookie-of-the-Year award winners to further illustrate the point; Trout has the 2nd lowest raise by any of the last 10 RoY winners (unsurprisingly, the penurious Marlins gave Chris Coughlan a lower raise after he won).  What Trout did was arguably more impressive than what either Kimbrel or Lincecum did; he unanimously won the Rookie of the Year and came in 2nd in MVP voting (a disputed MVP vote since Trout’s season from a statistical basis was one of the best in the history of the game).

Why antagonize your best player, your most important guy going forward, in order to save $100k??   This is the same team that is going to pay Vernon Wells $24.643 Million to be their 4th outfielder.  Jeff Miller, columnist for the Orange County Register, put it better than I could online; every one of his points is valid.

I just hope the Nationals never stoop to this sort of behavior just to save a few thousand dollars on a team worth hundreds of millions.

Written by Todd Boss

March 5th, 2013 at 8:43 am

Great article about PED usage from a former player

leave a comment

Posted yesterday 2/26/13 at BaseballProspectus.com from former player Eric Knott, who had a couple of cups of coffee over an 11 year professional career, including a stint with Montreal in 2003.

I’ve read some people who have claimed that “there’s no definitive proof that Steroids help baseball players.”  But I scoff at those claims; time and again we’re reading missives from former players brave enough to speak out who talk of utility infielders suddenly hitting 15 homers, and of middling relief pitchers suddenly adding 5mph to their fastballs and rocketing up the farm systems.

Knott’s article is no different.  You can claim stories like his and others are just coincidence, but it doesn’t take a huge leap of faith to connect the dots between steroid use, leading to increased strength and muscle mass, leading to increased power or velocity.

Also interesting is Knott’s take on “greenies” versus his opinions on Steroid use.  Clearly he differentiates between these two drugs despite both now being considered “performance enhancing.”

A good read.

Written by Todd Boss

February 27th, 2013 at 2:55 pm

Academy Awards (plus others) for Baseball Movies

4 comments

(Editor’s note: another article that I essentially wrote in Feb of 2011 but never got around to publishing; this has been a good couple of weeks of cleaning out the drafts).

Right around the time of the Academy Awards in 2011, Jim Caple wrote a fun pre-2011 Oscar review of historical baseball movies from an Academy Award perspective (where he picked the 6 major Academy Awards for baseball movies).  Caple’s awards for the “major” Oscar nominations were:

  • Best Picture: “Bull Durham
  • Best Director: Barry Levinson for “The Natural
  • Best Actor: Walter Matthau from “Bad News Bears
  • Best Actress: Susan Sarandon from “Bull Durham
  • Best Supporting Actor: Vic Morrow from “Bad News Bears
  • Best Supporting Actress: Madonna from “A League of their Own

(Other interesting movie links related to baseball I’ve stored over the years: Caple subsequently wrote a Moneyball review in September of 2012, and SBNation posted a list of the Greatest Baseball Movie Lines in history around the same time.  Here’s a recent link 50 Fun facts about sports movies that includes some Baseball trivia, and here’s a list of the Top Grossing Baseball movies of all time; the leader isn’t that surprising).

Being a fan of baseball movies myself, I’d quibble with some of Caple’s winners ( you have to see his list of “nominations” to really argue) but the article is a great read.  And it got me thinking: what other “Award Categories” for Baseball movies make sense to debate?

Here’s my Categories, and here’s a great list of baseball-themed movies to choose from.  Its a bit dated but gets most of the major films you need.   I fully admit that I have not seen every single baseball-related movie in the history of Hollywood, so feel free to debate the nominees that I’ve selected below.


Best Baseball Action Depicted

Nominations: Bull Durham, Major League, The Natural, Eight Men Out, 61*

Discussion: Eight Men Out was a fantastic period piece and did a great job.  Major League was a baseball movie for sure, but wasn’t nearly as good in terms of action as Bull DurhamBilly Crystal‘s pet project 61* did a great job as well.  I loved The Natural, its old-time baseball stadium shots, and the old school uniforms.  This is a tough call, but the winner goes to the one movie among all of these that was actually directed by a former minor league ball player. Winner: Bull Durham.  (Note: I considered and didn’t use Moneyball because of the actual footage intermixed in, and the general lack of baseball action in the movie).


Best Actor as a passable Baseball Player

Nominations: Kevin Costner (any of his several baseball movies), Robert Redford (The Natural), Randy Quaid (The Rookie), Thomas Jane (61*), Charlie Sheen (Major League), Dennis Haysburt (Major League), Jon Cusack (Eight Men Out), Ray Liotta (Field of Dreams).

Discussion: I nominate Liotta only because of the fact that Shoeless Joe Jackson batted lefty and Liotta spent months learning how to hit lefty for the role, only to have the director discard his abilities.   Similarly, Jon Cusack learned how to hit lefty and several of the baseball action scenes depict him swinging and hitting baseballs for long drives.  Quaid did an admirable job as Jim Morris and is quite an athlete, but did a far superior job as a quarterback in “Any Given Sunday.”

Dennis Haysburt deserves special mention by creating his iconic character, Pedro Ceranno.  He looked realistic at the plate and running the bases.  Redford was clearly a player, talking in the past of how he fashioned his game after fellow San Diego native Ted Williams, and his baseball scenes both hitting and pitching in the Natural are fantastic.  He comes in a close third.

The award comes down to Costner and Sheen.  Sheen (per his IMDB page) was a baseball pitcher in high school and could throw mid-80s naturally.  He looks great on the mound.  But for me, the fact that Costner could legitimately switch hit, played a convincing catcher throughout Bull Durham and a pitcher in For the Love of the Game give him the award.  Winner: Kevin Costner.


Worst Actor attempting to pass as a Baseball Player

Nominations: Tommy Lee Jones (Cobb), Tom Berenger (Major League), Tom Selleck (Mr. Baseball), Gary Cooper (Lou Gehrig), Tim Robbins (Bull Durham), John Goodman (The Babe), Brendan Frasor (The Scout).  Wesley Snipes (The Fan or Major League).

Discussion: Apparently actors love to do sports movies, because they all think they can, you know, play sports well.  Every guy who used to play pick up basketball thinks they can do “White Men Can’t Jump” and every guy who played little league thinks they can be in “Bull Durham.” I list a number of guys here, all of whom struggled in some way or another to appear athletic in a baseball movie.  In all fairness, most of these guys did decently well.  Berenger was in a tough spot, appearing as a catcher who threw like a girl.  Robbins did a pretty good job and was athletic enough to pass.  But the winner is most likely Gary Cooper, who apparently was so un-athletic that they gave up having him appear to be lefty, let alone make him look like Lou Gehrig.  This topic recently appeared again in some popular baseball blogs, with the researcher doing some pretty in-depth analysis to determine if this is actually a hollywood myth.  In any case, the Winner is Gary Cooper.


Best Movie Coach/Manager

Nominations: James Gammon (Lou from “Major League“), Tom Hanks (Jimmy Dugan from “A League of their Own“), Trey Wilson (Joe Riggens from “Bull Durham“), Wilford Brimley (Pop Fisher from “The Natural“), Walter Matthau (Bad News Bears), Philip Seymore Hoffman (Art Howe in “Moneyball”).

Discussion: A great set of character actors and performances here.  Lou from Major League has some memorable lines but wasn’t much of an acting job.  From a purely acting/role preparation perspective its hard to argue with Tom Hanks’ portrayal of the legendary Jimmie Foxx.  Pop Fisher was a good ole grandfather but didn’t exactly test the range of Wilford Brimely.  Hoffman is a fantastic actor in his own right, but by all accounts Art Howe isn’t even remotely like the character he played.

Walter Matthau probably put in the best pure acting job.  But the late Trey Wilson’s fantastic portrayal of the manager of the Durham Bulls, including his interaction with Crash Davis, his shower scene speech and his fighting with the umpires were legendary.  Winner: Trey Wilson.


Best Biopic of a player

Nominations: Cobb, Pride of the Yankees, Hustle, The Babe, The Rookie

Discussion: Honestly I didn’t really care for any of these movies that much.  The most recent of them (The Rookie) was interesting but not really that well done frankly.  Dennis Quaid was just a hair too old for the role and isn’t that good of an actor.  The Babe and Cobb were the two best shots, but both were such bad movies that one cannot pick them as the winner.  I think sentimentality dictates the winner here.  Winner: Pride of the Yankees.


Best Representation of Actual Baseball Events

Nominations: Eight Men Out, Soul of the Game, 61*, The Perfect Game

Winner: Eight Men Out. Doesn’t romanticize the events, presents them relatively slant-free.  I liked 61* in this respect, but Billy Crystal didn’t have the budget he really needed to compete with the excellent period piece about the Black Sox scandal.


Best Baseball Movie to trick your Wife into seeing

Nominations: How Do You Know, Fever Pitch, Summer Catch

Winner: Fever Pitch, but do you really want to see any of these movies?


Best Baseball Movie to take your kids to see

Nominations: Rookie of the Year, Angels in the Outfield, Little Big League, Air Bud: 7th Inning Fetch, The Sandlot

Winner: Air Bud 7th Inning Fetch.  Any movie where a dog gets to play baseball is a winner in my book.


Creepiest Baseball Movie to see

Nominations: The Bad News Bears, The Fan

Discussion: I put in the “Bad News Bears” as slightly “creepy” since our ideals of parenting, racial relations and what-not have changed so much since this movie was made.  So there are many parts that will make you cringe.

Winner: The Fan:  Robert DeNiro plays an obsessed fan of SF Giants outfielder Wesley Snipes.  This wins almost by default, since I can think of no other thriller/suspense baseball films.


Worst Baseball Movie

Nominations: Major League III Back to the Minors, Hustle, The Benchwarmers, Hardball

Discussion: There’s some pretty bad movies in here.  But nothing was as insufferable as the third edition of the Major League franchise.  It was bad enough that they made the second edition, with Omar Epps badly attempting to recreate Wesley Snipes‘ character.  But it went downhill in the third; the writing was bad, and all the leading stars from the first two installments declined to participate, leaving Corbin Bernsen and Dennis Haysbert as the last remaining characters from the original.  Winner: Major League III.


Best Drama

Nominations: The Natural, Bang the Drum Slowly, Field of Dreams, Pride of the Yankees, Moneyball

Discussion: Moneyball is the late entry here, garnering several Academy Award nominations and getting major Academy street cred by virtue of being written by Aaron Sorkin. I’m a sucker for old school tear-jerkers like the rest of them, meaning that Bang The Drum Slowly gets a nod.  Field of Dreams doesn’t hold up as much for me (though I fully admit I cannot watch the last scene without crying).  Up until Moneyball’s release, the winner for me was the excellent The Natural, despite its modified ending from the classic novel of the same name.  Winner: Moneyball.


Best Comedy

Nominations: Major League, Bull Durham, A League of their Own, Mr. 3000, The Bingo Long Traveling All-Stars and Motor Kings

Discussion: There’s three very quality finalists here, if I may immediately cut the Bernie Mac vehecile Mr. 3000 and the obscure Bingo movie.  Lets talk about them one by one.

A League of their Own depended on the slapstick sexual references from Madonna for its comedy most of the time, with thinly-veiled references to her nude portrait book or the fact that “most of america has seen her naked.”  Major League was a great comedy and had a great setup.  But for me nothing matches the subtleties and quality of the writing in Bull Durham.  Winner: Bull Durham


I KNOW this will generate discussion and disagreement.  Feel free to chime in with your thoughts.

Why is Toradol “ok” but Steroids and HGH “bad?”

9 comments

Did Papelbon inadvertantly open up a whole new PED angle? Photo Keith Allison via wikipedia/flickr

The latest salvo in the “Questionable Performance Enhancing Drug” storyline in today’s professional baseball landscape was this interesting statement from Jonathan Papelbon last week;  he and other Boston teammates frequently were injected with the drug Toradol by team doctors when they were feeling “run-down” or overly fatigued in order to get a quick pick-me-up for a game.  Apparently Toradol had the effect of giving players a four hour window of feeling “pretty damn good” and it was used by a portion of the Boston clubhouse.  Its also in use in many other clubhouses (though apparently not in Philadelphia, who told Papelbon his Toradol days were over).

Ok, how is Toradol not a Performance Enhancing Drug?  It certainly seems to qualify based on WADA’s “Three Criteria” for PEDs:

  1. The capacity to enhance performance (clearly, as discussed by Papelbon)
  2. Use can result in negative health consequences (absolutely; Jon Lester suffered some of them and had a serious internal bleeding issue, and now Boston is reportedly reviewing its use of the drug)
  3. Violate the spirit of sports. (opinion based .. but after reading what Toradol can do, how can you NOT argue that its use violates the “spirit of sports?”)

(2/15/13 update: The Red Sox trainer who administered all this Toradol apparently “flouted” state laws by doing so, as reported by Jeff Passan, who is all over this case.)

By the way, WADA adds a drug to its banned list if it qualifies for TWO of the above three categories (hence the addition of things like “Deer Antler Spray” despite it having no known side effects, since it clearly seems to violate the spirit clause).

This leads me to my larger question: Why is Toradol, and as a side effect Steroids and HGH “bad” but the use of Cortisone, Toradol considered “ok” in terms of usage?   What do Cortisone shots do?  They enable a player to play through pain that otherwise may keep him out.  Uh … isn’t that the definition of a “performance enhancing” substance??   Our own Ryan Zimmerman clearly benefited from cortisone shots in 2012; his before/after splits after receiving shots in his shoulder are pretty distinct and obvious.   Cortisone itself also fits the 3 WADA principles; it enhances performance, it has side-effects that many doctors are quite worried about, and I’m sure some would agree it changes the “spirit of the game” in some ways.

If your answer involves something along the lines of “PEDs are banned because they’re illegal” then I’ll counter with this: Steroid’s aren’t illegal; they’re just controlled.  But so is Cortisone; you can’t just inject yourself with the stuff without a doctor’s order.  And so is Toradol; you can’t go into your local supermarket and buy injectable Toradol.   And so is HGH: ask yourself why most elderly persons keep bottles of the stuff on their bed-side table?  Even something like a B-12 shot raises some issues; lots of players get B-12 shots and swear by the natural effect it has, but as with Toradol I’m pretty sure you can’t just get injectable B-12 and administer it yourself.  Even though B-12 is naturally occurring, in order to naturally consume the amounts of B-12 being injected you’d likely have to eat a bushel of clams (or some other high B-12 food) every day.

Honestly I may have the biggest issue with the classification of HGH as a PED, when you think about what HGH is (a naturally occurring growth hormone that is generates solely to help the body heal itself after an injury or illness) and then think about what Cortisone accomplishes for athletes.  So its “ok” to take a Cortisone shot that treats inflammation from an injury/strain so that you can go out and play better … but its NOT ok to take a naturally occuring suppliment to help with the same issue??  The only reason adults don’t heal as fast as kids is precisely because our natural HGH generation slows as we age … and doctors prescribe HGH to help the elderly heal from illnesses and injuries all the time.  Isn’t this inconsistent?

And all the above just talks about various medications.  Lets talk about the in-vogue plasma-replacement treatments that Kobe Bryant popularized and which have now been done by others, including Alex Rodriguez and Bartolo Colon. In this op-ed piece from Jeff Passan from Dec 2011, he discusses the blurry line between PEDs and legitimate surgical procedures.  The article has a very in-depth description of the A-Rod procedure and raises the question as to what defines a Performance Enhancing Drug?   If blood doping is illegal, how is a procedure that filters out platelets and re-injects them to targeted spots legal?  Colon was out of the game in 2010, got the procedure and suddenly is a 116 ERA+ pitcher in 2013; isn’t this concerning?

Passan takes things one step further, comparing the healing effects of HGH with these new treatments that A-Rod and Colon got and makes a very good point; these new-fangled surgical procedures absolutely qualify for WADA’s 3 criteria.  Passan has also asked the same questions I’m asking in a June 2006 article that started about HGH but ended with this same general question.  And he makes very good points about cortisone, HGH, Testosterone and even Tylenol usage.  Its worth a read.

Here’s another question: why is it “ok” to have performance-enhancing surgical procedures (Lasik surgery, Tommy John surgery, or any manner of surgery involving transplanted ligaments or tendons) but it is NOT ok to use drugs that have the same general effect?   If I can take a pill that gives me 20-10 vision, which enables me to see the baseball better and become a better hitter, would that be considered a PED?  I’m pretty sure … but yet people go get laser surgery and can get their eyes fixed to this level of quality any day of the week.  Perhaps this is a ridiculous example but my point stands; whether or not your performance is enhanced by virtue of a bottle or by the knife, aren’t these valid questions?  We’re starting to hear of psychotic parents of teen-aged pitchers actually getting “preventative” Tommy John surgery done, knowing that most pitchers who have the surgery see improvement in certain aspects of their game (since the Ulnar Ligament connector is actually strengthened in this surgery over how it grows naturally).  Is this … ethical?

And then there’s this interesting point, which was proposed on a BS Report podcast done between Bill Simmons and Chuck Klosterman last week.  If HGH is considered a PED, and HGH’s sole purpose in life is to help people get better after being sick … then why aren’t classes of anti-biotics such as Amoxicillin also considered PEDs?  What is the difference?   Klosterman then made the additional (scary) point that PED usage and testing may all be for naught eventually; Genetic testing and DNA manipulation may get to the point where there can BE no test to find out whether someone’s been genetically manipulated in order to be a superior athlete.  Testing has been trailing the science for years in professional sports … it may eventually be rendered completely moot.  Of course, taken the the ridiculous extreme, do we really want a slew of genetically engineered super-athletes competing for our enjoyment?  Why not just invent a bunch of robots to play these games?

Food for thought.  I know we’ve discussed some of these topics here before but do you worry about the inconsistencies in professional sports PED policies?  I’m not sure I have an easy solution, but I will say that the classifications of drugs seems arbitrary in some cases.

Stats Overview Part II: Hitting stats on the rise: wRC, wOBA, etc

2 comments

Trout's BABIP was very high in 2012; what does this mean for 2013? Photo Gary Vasquez/US Presswire via espn.com

(Part 2 in a series: Part 1 talked about Whats Wrong with Old School Baseball Stats).

More and more in modern baseball writing, you see relatively new statistical creations thrown into articles in order to prove or disprove an opinion, and more and more you almost need a glossary to properly read these articles and properly understand what the author is attempting to say.  I always want to understand that which I read, and at the same time I want to make sure I stay current and up-to-date on the stats out there, so I decided to do a little research (and pen my own post while I was at it) into some of these newer stats that are being used.

I’ll write about each stat, give links to its calculation, write about how it may be used, then put in some rules of thumb by which to consider the stat.

Pretty much every stat here is defined and available at either Baseball-reference.com or fangraphs.com.  BaseballProspectus.com also has some more obscure stats discussed further below.  I’ve always thought that B-R’s interface was so much easier to navigate that I tend to search there first, but a more complete set of stats is at fangraphs.

1. BABIP.  Batting Average on Balls in Play.  Most people know this one, but it is an important stat to consider in conjunction with other stats (especially the older Batting Average and Earned Run Average).   The calculation, as it is seen at Wikipedia, measures basically how many balls put into play (removing from consideration home runs) turned into hits.  Interestingly it penalizes the hitter for hitting sacrifice flies (not sure why).  This stat is kept for both individual hitters and for pitchers.

How is BABIP used? The measurement is essentially used as a checkpoint for fluky seasons.  If a pitcher has a very high ERA but also has a very high BABIP, one can explain that he’s been unlucky and his talent level lays somewhere below his posted performance on the year.  Ironically, the two leaders of Pitcher BABIP in 2012 were both on the Tigers; Rick Porcello and Max Scherzer had BABIPs of .344 and .333 respectively; this delta is probably going to lead to both of these guys having better ERAs in 2013.  If a hitter has a decent hitting season but also has a high BABIP, one usually says that the hitter was “lucky” and is due to regress (Mike Trout in 2012 had a Babip of .383.  That’s really high, probably unsustainably high, and he probably regresses statistically in 2013).

MLB Average/Rule of thumb: .290-.300 depending on the year.

When BABIP is high: a hitter is considered to be “lucky,” and future regression of more batted balls being turned into outs is expected.

When BABIP is low, a hitter is considered to be “unlucky,” and future improvement of more hits on batted balls is expected.

Caveats using BABIP: there are many arguments about whether some pitchers “baseline BABIP” should be modified based on their talent or capabilites.  For example, Mariano Rivera‘s career BABIP is .262 while R.A. Dickey‘s BABIP since he turned into a Mets knuckleballing starter is around .275.  Rivera’s lower baseline is probably attributed to his amazing cutter and his pure skill, while Dickey’s is most likely due to the fluctuations of hitting his knuckleball.  Meanwhile, some hitters maintain higher than average career BABIPs (two extreme examples that immediately come to mind are Ichiro Suzuki and Nyjer Morgan, with career BABIPs of .347 and .336 respectively.  Why so high?  Because both are skilled at bunting (or at least hitting choppy grounders) for base hits, artificially inflating their baseline BABIP.

2. ISO; Isolated Power.  As posted on Wiki, Isolated power can be simply calculated by subtracting a hitter’s batting average from the slugging percentage, or as it is more eloquently defined at FanGraphs, ISO is essentially a measure of how many extra base hits a batter hits per at-bat.  Slugging tells you how many bases per at bat a hitter obtains, but ISO strips out singles to isolate a player’s capability of hitting doubles, triples and homers.  Here’s a couple of decent examples from 2012; our own Bryce Harper hits a ton of extra base hits; he’s posted a .206 ISO for the 2012 season.  Meanwhile we know that the aforementioned Nyjer Morgan is not a very powerful hitter and ISO shows it; he’s at .069 for the 2012 season.  The league leaders for ISO reads like a list of MLB’s best sluggers.  Giancarlo Stanton would have led the league in ISO had he qualified; he posted a fantastic .318 ISO in 2012.

How is it used? ISO is used to measure how good a hitter is at getting extra-base hits.

MLB Average/Rule of thumb (from Fangraphs page) .145 is considered an “average” MLB ISO figure.  .200 is pretty good, .100 is poor.

Caveats using ISO: as with many sabremetric-tinged stats, small sample sizes greatly skew the figures.  Fangraphs says 550 ABs is needed before really drawing any judgements.

3. wOBA; Weighted On Base Average.  Created by Tom Tango, wOBA is a relatively newer statistic that attempts to improve upon the traditional batting statistics we use (Batting Average, Slugging and On Base Percentage) by measuring cumulative “weighted” hits that a batter may achieve.  It is based on the premise that the three traditional stats just mentioned all treat hitting events relatively the same.  Is a single equal to a double?  No, but in Batting Average it is.  Is a double worth half as much as a home-run?  No, but in the Slugging Percentage it is.  Each hitting event is weighted and added together, with increases/decreases for stolen bases/caught stealing thrown in, to arrive at a measurement that attempts to better quantify pure hitting.

How is it used?  wOBA attempts to be set to the same scale as the league wide OBP, which seems to hover around .315-.320 year to year.

MLB Average/Rule of thumb (from Fangraphs page) .320 is a good “league average” number.  .370 is great, .300 is poor.

Caveats using wOBA: There are several to keep in mind; the weights change  year to year, in order to normalize the stat across generations.  It is NOT normalized to park factors, so hitters in places like Boston and Colorado will have artificially inflated wOBAs to their true value.  Lastly, there’s zero context given to the game situation when measuring hits (i.e. was there a guy on third with one out?  Was it a close game in the 9th?)  I think particular situation is nearly impossible to measure in any stat, but it is important.

4. RC/wRC: Runs Created and Weighted Runs Created.  Runs Created is a stat that Bill James invented in one of his earlier Baseball Abstracts (1985) in order to try to measure simply how many runs an individual player contributed to the team in a given season.  It was improved upon vastly in 2002 to be much more detailed and accurate; the original version over-emphasized some factors of hitting.  It is a complicated statistic (see its wiki page for the formula).  The aforementioned Tom Tango improved upon the basic RC by creating the Weighted version of the statistic based on his own Weighted OBA statistic (which he believed more closely measures the proper “value” of each hitting event).

How is it used?  Individually, RC and wRC need to be understood in context of an entire season.  It isn’t until we get to wRC+ (see below) that a side-by-side comparison is capable.  Its like saying “Player X has 105 hits.”  If that’s through 75 games, that’s pretty good; if that’s for an entire season, well that’s pretty poor.

MLB Average/Rule of thumb (from Fangraphs page) RC and wRC both have roughly the same scales.  60 is average, 100 is great, 50 is poor for a full season.

Caveats using RC and wRC: They are basically full season counting numbers.  In 2012, Trout started in the minors, so his RC and wRC totals are less than his MVP competition Miguel Cabrera.

5. wRC+/wRAA: Weighted Runs Created Plus/Weighted Runs Above Average

wRAA and especially wRC+ are touted by fangraphs.com as being very good “single number” statistics to properly measure a player’s hitting ability.  I often use OPS+ as a singular number to measure a hitter; fangraphs specifically calls out this number and recommends using wRC+.

How is it used?  Both numbers basically measure the same thing.  wRC+ is a bit easier to explain; 100 is the league baseline, and points above or below the average are expressed as “percentage points above or below the league average.”  So, a person with a 120 wRC+ is considered to be 20% better at creating runs than the average major leaguer.  Cabrera and Trout ironically tied for the MLB lead for 2012 in wRC+, each posting a 166 wRC+.  Meanwhile wRAA (per fangraphs.com) “measures the number of offensive runs a player contributes to their team compared to the average player” and is scaled to zero.  wRAA is essentially a direct calculation from wOBA, so if you’re using one you can likely ignore the other.

MLB Average/Rule of thumb (from Fangraphs page) for wRC+: 100 is average while for wRAA zero (0) is average.  20-25 percentage points above is great, while 15-20 percentage points below is bad.

Caveats for using: Unlike wOBA, wRC+ is park- and league-adjusted, indeed making it an excellent single number by which to measure players.  Otherwise the caveats for these weighted averages are all about the same; they seem to be based on an weighting of hits that you may or may not agree with.


What have I learned from looking into these hitting stats?  I need to keep BABIP in mind.  I like ISO but I don’t see it gaining real credence over slugging percentage.  And I should probably start using wRC+ more than OPS+.

Part 3 coming up on Pitching advanced stats.

Cal Ripken Burgers??

leave a comment

I'm sure they're really tasty. Photo unknown via baltimoresports.report.com

Because when I think of frozen burger patties, I think of Cal Ripken Jr.

I was shopping at Giant over the weekend and did a double-take in the frozen food aisle.  Did you guys know that Ripken is hawking a line of burgers?  I didn’t.  A bit of google work shows that they’ve been on the market since May of 2012.

Is it just me, or is this a relatively random athlete-food connection?  This would be like Reggie Jackson having his own candy bar.  Oh wait… 🙂

Written by Todd Boss

February 3rd, 2013 at 2:34 pm

Stats Discussion Part I: What’s wrong with Wins and RBI?

15 comments

Cabrera's MVP award was thought to be on the backs of "bad stats." Is this a bad thing in general? Photo AP via sportingnews.com

(First Article in a series discussing Baseball Statistics that I mostly wrote months ago and was waiting for downtime to post.  As it happens, the posts that I have in the can for months on end tend to get rather bloated; this one is > 3000 words.  Apologies in advance if you think that’s, well, excessive).

(Note: a good starting point/inspiration for this series was a post from February 2012 on ESPN-W by Amanda Rykoff, discussing some of the stats used in the movie Moneyball.  Some of the stats we’re discussing in the next few posts are covered in her article).

The more you read modern baseball writing, the more frequently you see the inclusion of “modern” baseball statistics interspersed in sentences, without definition or explanation, which are thus used to prove whatever point the writer is making.   Thus, more and more you need a glossary in order to read the more Sabr-tinged articles out there.  At the same time, these same writers are hounding the “conventional” statistics that have defined the sport for its first 100 years and patently ridiculing those writers that dare use statistics like the RBI and (especially as of late) the pitcher Win in order to state an opinion.  This is an important trend change in Baseball, since these modern statistics more and more are used by writers to vote upon year ending (and career defining) awards, and as these writers mature they pour into the BBWAA ranks who vote upon the ultimate “award” in the sport; enshrinement into the Hall of Fame.

This year’s AL MVP race largely came down to the issue of writers using “old-school” stats to value a player (favoring Miguel Cabrera and his triple-crown exploits) versus “new-school” stats to value a player (favoring Mike Trout, who may not have as many counting stats but has put in a historical season in terms of WAR).  And as we saw, the debate was loud, less-than-cordial, and merely is exacerbating a growing divide between older and newer writers.  This same argument is now seen in the Hall of Fame voting, and has gotten so derisive that there are now writers who are refusing to vote for anyone but their old-school stat driven pet candidates as a petulant reaction to new-school writers who can’t see the forest for the trees in some senses.

A good number of the stats that have defined baseball for the past 100 years are still considered “ok,” within context.  Any of the “counting stats” in the sport say what they say; how many X’s did player N hit in a season?  Adam Dunn hit 41 homers in 2012, good for 5th in the league.  That’s great; without context you’d say he’s having a good, powerful season.  However you look deeper and realize he hit .204, he didn’t even slug .500 with all these homers and he struck out at more than a 40% clip of his plate appearances.  And then you understand that perhaps home-runs by themselves aren’t the best indicators of a player’s value or a status of his season.

Lets start this series of posts with this topic:

What’s wrong with the “old school” baseball stats?

Most old school stats are “counting” stats, and they are what they are.  So we won’t talk about things like R, H, 2B, 3B, HR, BB, K, SB/CS.  There’s context when you look at some these numbers combined together, or if you look at these numbers divided by games or at-bats (to get a feel for how often a player hits a home run or steals a base or strikes out a guy).  In fact, K/9, BB/9 and K/BB ratios are some of my favorite quick evaluator statistics to use, especially when looking at minor league arms.  But there are some specific complaints about a few of the very well known stats out there.  Lets discuss.

1. Runs Batted In (RBI).   Or as some Sabr-critics now say it, “Really Bad Stat.”   The criticism of the RBI is well summarized at its Wiki page; it is perceived more as a measure of the quality of the lineup directly preceeding a hitter than it is a measure of the value of the hitter himself.  If you have a bunch of high OBP guys hitting in front of you, you’re going to get more RBIs no matter what you do yourself.  Another criticism of the stat is stated slightly differently; a hitter also benefits directly from his positioning in the lineup.  A #5 hitter hitting behind a powerful #4 hitter will have fewer RBI opportunities (in theory), since the #4 hitter should be cleaning up (no pun intended) the base-runners with power shots.  Likewise, a lead-off hitter absolutely has fewer RBI opportunitites than anyone else on the team; he leads-off games with nobody on base, and hits behind the weakest two hitters in the lineup every other time to bat.

I’m not going to vehemently argue for the RBI (the points above are inarguable).  But I will say this; statistical people may not place value on the RBI, but players absolutely do.  Buster Olney touched on this with an interesting piece in September that basically confirms this;  if you ask major leaguers whether RBIs are important you’ll get an across-the-board affirmative.  Guys get on base all the time; there’s absolutely skill and value involved in driving runners home.  Guy on 3rd with one out?  You hit a fly ball or a purposefully hit grounder to 2nd base and you drive in that run.  Players absolutely modify the way that they swing in these situations in order to drive in that run.  And thus RBI is really the only way you can account for such a situation.  The Runs Created statistics (the original RC plus the wRC stats) don’t account for this type of situation at all; it only measures based on hits and at-bats.

(As a side-effect, the statistic Ground-into Double Plays has a similar limitation to RBI: it really just measures how many batters were ahead of you on base as opposed to a hitter’s ability to avoid hitting into them.  But thankfully GIDP isn’t widely used anywhere).

2. Batting Average (BA): The isolated Batting Average is considered a “limited” stat because it measures a very broad hitting capability without giving much context to what that hitter is contributing to the end goal (that being to score runs).  A single is treated the same as a home run in batting average, despite there being a huge difference between these two “hits” in terms of creating runs.  This is exemplified as follows: would you rather have a .330 hitter who had zero home runs on the season, or a .270 hitter who hit 30 home runs?   Absolutely the latter; he’s scoring more runs himself, he’s driving in more runs for the team, and most likely by virtue of his power-capability he’s drawing more walks than the slap hitting .330 hitter.  More properly stated, the latter hitter in this scenario is likely to be “creating more runs” for his team.

Statistical studiers of the game learned this limitation early on, and thus created two statistics that need to go hand in hand with the Batting Average; the On-Base Percentage (OBP) and the Slugging Percentage (SLG). This is why you almost always see the “slash line” represented for hitters; to provide this context.  But, be careful REPLACING the batting average with these two numbers (or the OPS figure, which represents On-Base percentage + Slugging).  Why?  Because Batting Average usually comprises about 80% of a players On base percentage.  Even the highest walk guys (guys like Adam Dunn or Joey Votto) only have their walk totals comprising 17-18% of their OBP.  If you sort the league by OBP and then sort it by BA, the league leaders are almost always the same (albeit slightly jumbled).  So the lesson is thus; if someone says that “Batting Average is a bad stat” but then says that “OBP is a good stat,” I’d question their logic.

Lots of people like to use the statistic OPS (OBP+SLG) as a quick, shorthand way of combing all of these stats.  The caveat to this is thus; is a “point” of on-base percentage equal to a “point” of slugging?  No, it is not; the slugging On Base Percentage point is worth more because of what it represents.  Per the correction provided in the comments, 1.7 times more.

Coincidentally, all of the limitations of BA are attempted to be fixed in the wOBA, which we’ll discuss in part 2 of this series.

3. ERA: Earned Run Average.  Most baseball fans know how to calculate ERA (earned runs per 9 innings divided by innings pitched), and regularly refer to it when talking about pitchers.  So what’s wrong with ERA?

Specifically, ERA has trouble with situations involving inherited runners.  If a starter leaves a couple guys on base and a reliever allows them to score, two things happen:

  • those runs are charged to the starter, artifically inflating his ERA after he’s left the game.
  • those runs are NOT charged to the reliever, which artificially lowers his ERA despite his giving up hits that lead to runs.

ERA is also very ball park and defense dependent; if you pitch in a hitter’s park (Coors, Fenway, etc) your ERA is inflated versus those who pitch in pitcher parks (Petco, ATT).  Lastly, a poor defense will lead to higher ERAs just by virtue of balls that normally would be turned into outs becoming hits that lead to more runs.  Both these issues are addressed in “fielder independent” pitching stats (namely FIP), which are discussed in part III of this series.

A lesser issue with ERA is the fact that it is so era-dependent.  League Average ERAs started incredibly high in the game’s origin, then plummetted during the dead ball era, rose through the 40s and 50s, bottomed out in the late 60s, rose slightly and then exponentially during the PED era and now are falling again as more emphasis is placed on power arms and small-ball.  So how do you compare pitchers of different eras?  The ERA+ statistic is great for this; it measures a pitcher’s ERA indexed to his peers; a pitcher with an 110 ERA+ means that his ERA was roughly 10% better than the league average that particular year.

4. Pitcher Wins.  The much maligned “Win” statistic’s limitations are pretty obvious to most baseball fans and can be stated relatively simply; the guy who gets the “Win” is not always the guy who most deserves it.  We’ve all seen games where a pitcher goes 7 strong innings but his offense gives him no runs, only to have some reliever throw a 1/3 of an inning and get the Win.  Meanwhile, pitchers get wins all the time when they’ve pitched relatively poorly but their offense explodes and gives the starter a big lead that he can’t squander.

Those two sentences are the essence of the issue with Wins; to win a baseball game requires both pitching AND offense, and a pitcher can only control one of them (and his “control” of the game is lost as soon as the ball enters play; he is dependent on his defense to get a large majority of his outs, usually 60% or more even for a big strike out pitcher).  So what value does a statistic have that only measures less than 50% of a game’s outcome?

The caveat to Wins is that, over the long run of a player’s career, the lucky wins and unlucky loseses usually average out.  One year a guy may have a .500 record but pitch great, the next year he may go 18-3 despite an ERA in the mid 4.00s.  I have to admit; I still think a “20-game winner” is exciting, and I still think 300 wins is a great hall-of-fame benchmark.  Why?  Because by and large wins do end up mirroring a pitcher’s performance over the course of a year or a career.  The downside is; with today’s advances in pitcher metrics (to be discussed in part III of this series), we no longer have to depend on such an inaccurate statistic to determine how “good” a pitcher is.

Luckily the de-emphasis of Wins has entered the mainstream, and writers (especially those who vote for the end-of-year awards) have begun to understand that a 20-game winner may not necessarily be the best pitcher that year.  This was completely evident in 2010, when Felix Hernandez won the Cy Young award despite going just 13-12 for his team.  His 2010 game log is amazing: Six times he pitched 7 or more innings and gave up 1 or fewer runs and got a No Decision, and in nearly half his starts he still had a “quality start” (which we’ll talk about below briefly).  A more recent example is Cliff Lee‘s 2012 performance, where he didn’t get a win until July, getting 8 no-decisions and 5 losses in his first 13 starts.  For the year he finished 6-9 with a 3.16 ERA and a 127 ERA+.  Clearly Lee is a better pitcher than his W/L record indicates.

(Coincidentally, I did a study to try to “fix” pitcher wins by assigning the Win to the pitcher who had the greatest Win Percentage Added (WPA).  But about 10 games into this analysis I found a game in April of 2012 that made so little sense in terms of the WPA figures assigned that I gave up.  We’ll talk about WPA in part 4 of this series when talking about WAR, VORP and other player valuation stats).

5. Quality Starts (QS) Quality Starts aren’t exactly a long standing traditional stat, but I bring them up because of the ubiquitous nature of the statistic.  It is defined simply as a start by a pitcher who pitches 6 or more innings and who gives up 3 or less earned runs.   But immediately we see some issues:

  1. 6 IP and 3 ER is a 4.50 ERA, not entirely a “quality” ERA for a starter.  In fact, a starter with a 4.50 ERA in 2012 would rank  him 74th out of 92 qualified starters.
  2. If a pitcher pitches 8 or 9 complete innings but gives up a 4th earned run, he does not get credit for the quality start by virtue of giving up the extra run, despite (in the case of a 9ip complete game giving up 4 earned runs) the possibility of actually having a BETTER single game ERA than the QS statistic defaults to.

Why bring up QS at all?  Because ironically, despite the limitations of the statistic, a quality start is a pretty decent indicator of a pitcher’s performance in larger sample sizes.  Believe it or not, most of the time a quality start occurs, the pitcher (and the team) gets the win.  Take our own Gio Gonzalez in 2012; he had 32 starts and had 22 quality starts.  His record? 21-8.  Why does it work out this way?  Because most pitchers, when you look at their splits in Wins versus Losses, have lights out stuff in wins and get bombed during losses.  Gonzalez’s ERA in wins, losses and no-decisions (in order): 2.03, 5.00 and 4.32.  And, in the long run, most offenses, if they score 5 or more runs, get wins.  So your starter gives up 3 or fewer runs, hands things over to a bullpen that keeps the game close, your offense averages 4 runs and change … and it adds up to a win.

I used to keep track of what I called “Real Quality Starts (rQS)” which I defined as 6 or more IP with 2 or fewer earned runs, with allowances for a third earned run if the pitcher pitched anything beyond the 6 full innings.  But in the end, for all the reasons mentioned in the previous paragraph, this wasn’t worth the effort because by and large a QS and a rQS both usually ended up with a Win.

6. Holds: A “hold” has a very similar definition as the Save, and thus has the same limitations as the Save (discussed in a moment).  There was a game earlier this season that most highlights the issues with holds, as discussed in this 9/21/12 post on the blog Hardball Times.  Simply put; a reliever can pitch pretty poorly but still “earn” a hold.

Holds were created as a counting stat in the mid 1980s in order to have some way to measure the effectiveness of middle relievers.  Closers have saves, but middle-relief guys had nothing.  The problem is; the hold is a pretty bad statistic.  It has most of the issues of the Save, which we’ll dive into last.

7. Saves. I have “saved” the most preposterous statistic for last; the Save.  The definition of a Save includes 3 conditions that a reliever must meet; He finishes a game but is not the winning pitcher, gets at least one out, and meets certain criteria in terms of how close the game is or how long he pitches.  The problem is that the typical “save situation” is not really that taxing on the reliever; what pitcher can’t manage to protect a 3 run lead when given the ball at the top of the ninth inning?  You can give up 2 runs, still finish the game, have a projected ERA of 18.00 for the outing and still get the save.  Ridiculous.  And that’s nothing compared to the odd situation where a reliever can pitch the final 3 innings of a game, irrespective of the score, and still earn a save.  In the biggest blow-out win of the last 30 years or so (the Texas 30-3 win over Baltimore in 2007), Texas reliever Wes Littleton got a save.  Check out the box score.

I wrote at length about the issue with Saves in this space in March of 2011, and Joe Posnanski wrote the defining piece criticising Saves and the use of closers in November 2010.  Posnanski’s piece is fascinating; my biggest takeaway from it is that teams are historically winning games at the exact same rate now (with specialized setup men and closers) that they were winning in the 1950s (where you had starters and mop-up guys).

I think perhaps the most ridiculous side effect of the Save is how engrained in baseball management it has become.  Relievers absolutely want Saves because they’re valued as counting numbers they can utilize at arbitration and free agency hearings to command more salary (I touched on in a blog post about playing golf with Tyler Clippard this fall; he absolutely wanted to be the closer because it means more money for him in arbitration).  Meanwhile, there are managers out there who inexplicably leave their closer (often their best reliever, certainly their highest paid) out of tie games in late innings because … wait for it … its not a save situation.  How ridiculous is it that a statistic now alters the way some managers handle their bullpens?

What is the solution?  I think there’s absolutely value in trying to measure a high leverage relief situation, a “true save” or a “hard save.”  Just off the top of my head, i’d define the rules as this:

  • there can only be a one-run lead if the reliever enters at the top of an inning
  • if the reliever enters in the middle of an inning, the tying run has to at least be on base.
  • the reliever cannot give up a run or allow an inherited run to score.

Now THAT would be a save.  Per the wikipedia page on the Save, Rolaids started tracking a “tough save” back in 2000, and uses it to help award its “Fireman of the Year” award, but searching online shows that the stats are out of date (they’re dated 9/29/11, indicating that either they only calculate the Tough Saves annually, or they’ve stopped doing it.  Most likely the former frankly).


Phew.  With so many limitations of the stats that have defined Baseball for more than a century, its no surprise that a stat-wave has occurred in our sport.  Smart people looking for better ways to measure pitchers and batters and players.

Next up is a look at some of the new-fangled hitting stats we see mentioned in a lot of modern baseball writing.

Adult Baseball in the DC Area

20 comments

We’ve mentioned local area baseball leagues a lot lately in posts here.  I talked about my own experiences playing youth and adult baseball in my “All Virginia post” and many of the readers here have shared experiences playing in the local leagues in the comment sections of that post and in the comments section of a late December post.

I thought it’d be of service to readers to summarize information of known adult leagues for anyone who is perhaps interested in getting back to playing, or who knows someone looking for a team.  If you’re looking for a place to play this summer, now is the time to reach out and start making contacts/sign up to play.

I’ll list these leagues in perceived order of talent/skill/intensity from highest to lowest.  Each site also has links for those who may want to look into playing or watching.  I’m not including any youth, AAU, travel, American Legion, Babe Ruth or Cal Ripken (not to be confused with the Cal Ripken collegiate league) baseball here; we’ll start with College-age Adult baseball.

1. DC-Area Summer Collegiate Leagues: The wood-bat Cal Ripken Collegiate League has teams from DC, Maryland and Virginia and is the successor to the long-running Clark Griffith League, which formerly was one of the longest running wood-bat leagues in the nation.  The Clark Griffith league suspended operations in 2010 and has not been able to re-start itself.  Meanwhile the Cal Ripken league has flourished and expanded, taken some of the former Griffith teams and now has 10 teams competing.  The marquee team is the Bethesda Big Train, named after Walter Johnson and whose home games are at the fantastic Shirley Povich field in Bethesda (also the home-stadium of Georgetown University).  If you havn’t seen games at Povich, you should take a drive up there one night this summer and take in a game.  The quality of play is good (the players are either Division-1 college players or elite HS prospects) and the field is great.

The Cal Ripken league is a step down from the famed Cape Code League in terms of summer college talent … but then again nearly every other wood bat summer league is a step down as well.  Of the dozens of summer leagues out there, most pundits would rank the Cal Ripken league as a 3rd tier quality league (2nd tiers being leagues like the Valley League, the Northwest league, the Alaska league or the Coastal Plains leagues).  But the Cal Ripken league definitely has its share of pro alumni.

Eligibility: you must have college eligibility left to play in this league.  High Schoolers are eligible but rare.  Teams are competitively assembled and hand selected.

2. The Industrial League: The Industrial League is the most elite level of adult baseball in the area, filled with ex-Collegiate players and ex-Pros to serve as close to a “semi pro” league as we have in the area.  The current incarnation of the Industrial league plays Wood Bat and is the combination of two long-standing leagues (the “Industrial League” and the “Credit Union” league).   The old Credit Union used to play with Aluminum, but went to Wood fully upon its dissolvement.  There’s only a handful of teams; this league used to be much healthier.  The “history” page on the website is informative and gives some great background on the league itself and its origins.

By way of comparison; industrial teams used to scrimmage the Clark Griffith teams and would get wiped out.  Not so much because of talent, but because of depth.  These college summer league teams have full rosters and massive bullpens.

Eligibility: no restrictions; anyone can play at any age.  No restrictions on time sitting out if you are an ex-pro.

3.  DCMSBL/MABLDC Mens Senior Baseball League: a large adult baseball league (the 2nd largest Adult league in the Nation according to MSBL’s records) with divisions ranging from 19 and up to 55 and up.   DCMSBL started in 1991 (this year is its 25th anniversary) with just a 30+ division and now has dozens of teams split amongst 19+, 25+, 35+,45+,55+ and a wood-bat only league that crosses age divisions.  In 2012 the league had no less than 75 teams among all these divisions (each team has to have a minimum of 15 registered players, meaning there’s more than 1100-1200 players in the league).  Note: MABL stands for Mens Adult Baseball League, which was formerly the under 30 adult league now rolled into one organization).

The DCMSBL amateur league is pretty decent baseball.  The 19-and up is essentially a low-end collegiate summer league (though not nearly as talented as Cal Ripken).  There is some overlap with teams in the Industrial league and the Cross-age group woodbat leagues.  The 25 and up division has a large number of ex-college players and ex-pros, and the 35-and up teams have more than their fare share of ex-major leaguers as well.  Its not uncommon to face a guy in the 25+ division who was a starter for his Division-1 college team for 4 years and is just a few years removed from that level of competition.  There’s enough teams so that there are “upper” and “lower” divisions of play within each age group.  From an intensity standpoint, the “upper” divisions are quite competitive each year while the “lower” divisions are less intense but certainly not a “beer drinking” division like you’d see if you were playing softball.

Teams are organizing right now for play that starts in the first week of April.  There’s a player waiting list that you can sign up for at the website www.dcmsbl.com.

Note: there is also the Chesapeake MSBL that covers the Annapolis, Southern Maryland and Howard county areas with similar rules and talent levels to DCMSBL.  The two leagues play an all-star game at season’s end in one of the local minor league stadiums (this year in Frederick).

Eligibility: ex-professionals must sit out a year (I believe) before being eligible to play.

4. DC Wood Bat League, formerly associated with NABA and which absorbed teams from the old WARBL.  It had 12 teams for 2012 but in prior years had as many as 20 teams.  There seems to be some overlap between DCWood and DCMSBL teams, and this league definitely has had some talented teams in the past.   They play longer schedules than the DCMSBL guys.

Readers who know this league: how does it fare competition wise to DCMSBL?  I have suspected it is slightly lower in skill level but have no direct experience one way or the other.

Eligibility: 19+, no known pro restrictions.

5. Ponce de Leon league, owned and operated by Bob Duff, serves as an excellent low-key competitive league for players to play.   There are a slew of very specific competition rules that control the flow of games, prevent blowouts and limit the ability of pitchers to dominate the league.  But this league also guarantees participation and is a great option for guys who havn’t played in years or who are nervous about the intensity of the above leagues.

It is now affiliated with the DC Wood bat league somehow; this is a new affiliation and I don’t know all the details other than what’s on the websites.

Ponce has two age divisions; 30+ and 48+.  You have to be at least 30 and cannot pitch unless you’re at least 36 in the younger division.

Eligibilty:  30+ with restrictions as noted above.  No known pro restrictions.

6. Eastern Women’s Baseball Conference: the EWBC is an Adult Womens baseball league with teams from DC to Baltimore that plays competitively.  I must admit; I had not heard about them until prompted by suggestions.

7.  Other leagues that I’ve heard of that may or may not still be around:  I know there’s a small league in Southern Maryland called the Charles St. Mary’s League. It plays wood bat and has been around since the 1940s.  I can’t tell if this is what remains of the old “Chesapeake Independent Baseball League” or not.  The CIBL was also colloquially known as the Chicken Leagues and was truly semi-pro baseball; guys would get paid to come out and play.  As mentioned, the old Credit Union got rolled into the Industrial league a few years back.  WARBL got rolled into NABA.

Some of these links come courtesy of Bob Schnebly‘s website.  Schnebly has been involved in DC area amateur baseball for years; we ran into him in the Credit Union/Industrial league in the early 1990s.  His website is an interesting read for those familar with him or baseball in the area.


I’d love to hear from you if you’re familiar with any other area leagues that I may have missed, or if you have some thoughts on the post here.

Written by Todd Boss

January 22nd, 2013 at 8:49 am