Nationals Arm Race

"… the reason you win or lose is darn near always the same – pitching.” — Earl Weaver

Archive for the ‘clayton kershaw’ tag

2014 Fantasy Baseball post-mortem

3 comments

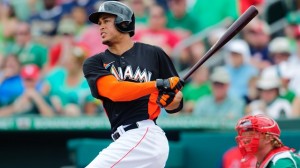
Stanton blasting another 450-foot homer.  Photo unk via rantsports.com

Stanton blasting another 450-foot homer. Photo unk via rantsports.com

(Standard disclaimer; this is ranting about my fake baseball team.  If you don’t play fantasy, might as well skip this).

I’m really beginning to question my abilities in fantasy sports.  Despite being deep into baseball and knowing random things off the top of my head that should be of use in fantasy (which managers are more inclined to do closer by committee, which ball parks are skewed offensively and thus players who play there may be at an advantage), I struggle year after year.

This year, thanks to an unfortunately timed meltdown (I lost a week 0-10-2 after having been ahead early in the week), I dropped just out of the playoff spots in my league (top 6 make the playoffs out of a 12 team league).  But the ills of my team were seen early.  Once again, I was plagued by under performing players and a poor draft that left me churning the waiver wire.  By the end of the season I had made 58 of the 65 allotted moves in a failed attempt to improve enough to sneak into the playoffs (where honestly, I would have been a tough out; I can grind out 6-5-1 wins with the best of them).

So, what happened?  Here’s a link to the post talking about my initially drafted team.  And here’s a matrix of my 21 initially drafted players, their performance on the year and a note indicating whether or not they over- or under-achieved (bold means on the team at  year’s end, red = badly under performed, green = greatly over-performed).

Player round Drafted/# Drafted overall Yahoo o-rank 2013 Yahoo O-rank 2014 ADP at time of draft 2014 Perf Rank
Adam Jones-OF 1st round (#10 overall) 7 13 10th/11.4 21
Adrian Beltre-3B 2nd round (#15) 15 12 13th/13.2 46
Alex Rios-OF 3rd round (#34) 25 44 34th/35 179
Giancarlo Stanton-OF 4th round (#39) 222 26 24th/27.8 5
Kenly Janssen-RP 5th round (#58) 52 48 49th/53.2 102
Greg Holland-RP 6th round (#63) 36 63 62nd/62 60
Mark Trumbo-1B/OF 7th round (#82) 66 78 53rd/56.0 944
Carlos Santana-C/1B 8th round (#87) 134 87 69th/74.0 159
Shelby Miller-SP 9th round (#106) 76 88 110th/113.0 485
Hyung-Jin Ryu-SP 10th round (#111) 85 101 124th/127.2 95
Aaron Hill-2B 11th round (#130) 402 111 124th/115.8 364
Danny Salazar-SP 12th round (#135) 336 96 154th/150.4 355
Tony Cingrani-SP 13th round (#154) 152 133 156th/156.8 941
Jim Henderson-RP 14th round (#159) 130 155 170th/175.0 750
Shane Victorino-OF 15th round (#178) 67 113 125th/129.0 1144
Chris Archer-SP 16th round (#183) 175 171 208th/209.0 314
Asdrubal Cabrera-SS 17th round (#202) 267 151 171st/177.4 177
J.J. Hoover-RP 18th round (#207) 237 629 344th 922
Tim Hudson-SP 19th round (#226) 299 300 311th 171
Brandon Belt-1B 20th round (#231) 106 104 142th 988
Jake Odorizzi-SP 21st round (#250) 548 358 445th 197

So, what happened?

My first two picks didn’t underperform “badly,” but were not the super stars you need to take hold of a league.  I didn’t really like Adam Jones or Adrian Beltre at the draft, and despite some hot streaks they’ve been disappointments.  Beltre got hurt in camp and missed games at the beginning of the season.  My #3 pick Alex Rios I finally gave up on and waived; his seasonal rank of 179 belies what he’s done the last two months (closer to the 900 ranked range).  It’s never a good sign when your #3 pick gets waived thanks to performance (and not injury) reasons.

Giancarlo Stanton is my one major “win” out of the draft; a 4th round pick who likely will finish in the top 5 of stats on the season.  At the time of this writing, he was trailing only Mike Trout in terms of fantasy rankings for offensive players.  He single-handedly carried my team offensively for weeks on end and is a large reason that my team offense was 1st in homers and 3rd in RBI.   I feel vindicated here: I suffered through at least two injury-riddled Stanton seasons in the past after having drafted him highly, and he’ll have the same issue next year; he’ll likely be a top-5 pick with a huge injury risk on his head.

My two big-time closers did not disappoint: both Janssen and Holland performed as expected and led me to be 5th in team saves and  have a 14-7-1 record in the category on the year.  This is a big lesson learned for me; you can get by with just two big-time closers and be successful in this category.  Of course, I wanted more closers but got unlucky; my #3 closer Jim Henderson suddenly and without warning was yanked from the role on opening day.  Another team vultured his replacement (Francisco “K-rod” Rodriguez); all he’s done is pitch lights out all year and is 6th in the league in saves.  That should have been my 3rd closer.  That was a disappointment.  I tried just one waiver-wire closer grab (Chad Qualls for Houston) and despite picking correctly, Qualls went weeks without save opportunities so I dumped him after two weeks looking for more starter quality.

Lets talk about the god-awful positional player issues I had in the draft: Mark Trumbo started out white-hot, fractured his foot and missed months.  Aaron Hill did not come closer to living up to the hype of fantasy analysts.  Shane Victorino was on and off the D/L all year.  And poor Brandon Belt fractured his thumb, fought his way back and then got hit in the head during BP and still remains on the concussion D/L.

Of the Starting Pitchers I gambled on: Shelby Miller struggled all  year, Danny Salazar got demoted, as did Tony Cingrani.  Chris Archer did not produce at fantasy levels and Jake Odorizzi struggled early and was dropped (I eventually picked him back up).  I only kept two drafted starters on the team all year (Ryu and  Hudson) and frankly Hudson was so bad for so long that I came pretty close to dumping him.  That basically means that my “wait on starters” strategy was a complete failure, if I’m only keeping ONE decent starter the whole  year.

So, for the 2nd straight year I cycled the waiver wires.  Here’s some of the guys I went through:

  • Starters: Scheppers, Kluber, Eovaldi, Skaggs, Kennedy, Strohman, Peralta, Montero, Keuchel, Garcia, Beckett,  Wood, Leake, Despaigne, Bauer, Liriano, Duffy, Hellickson, Cole, Smyly
  • Relievers: Qualls
  • Catchers: Mesoraco, Ruiz
  • 1B: Francisco, Adams, Alonso, Singleton, Napoli, Carter, Duda
  • 2B: Walker, Prado, Gennett, Wong
  • SS: Aybar, Escobar, Baez, Betts
  • 3B: Castellanos, Seager, Arenado
  • OF: Rasmus, Parra, Stubbs, Crawford, Ozuna, Eaton, Reddick, Aoki

Scheppers I took a gamble on b/c his numbers were so good as a reliever; mistake.  He got shelled opening day and soon was on the D/L.   A number of these pitchers were decent moves and pitched well for a while (especially Josh Beckett and Marcus Strohman).  The biggest failure here was dumping Corey Kluber after he got hit hard opening day: He’s turned into the 16th best fantasy performer all year, a 2nd round talent.  That was a huge mistake.  I liked Eovaldi‘s peripherals (lots of Ks) but he struggled with runners and his ERA/WHIP were inflated all year.  Skaggs got hurt, Kennedy was ineffective.  I got great value for a while out of Keuchel, but after a good mid-summer he tailed off badly.  Garcia made like one start before returning to the D/L.  Josh Beckett was a great waiver wire pickup for a while, but he too got hurt and remains on the D/L today.  Alex Wood was a great find.  I snaked Gerrit Cole off the D/L just before he came back on but he contributed little.  Most of my other experiments were far too inconsistent week-to-week to trust (see Trevor Bauer, Despaigne, Mike Leake, etc).

As mentioned before, I only tried to gamble on one closer waiver wire pickup thanks to the solid two starters that I had from draft day.  Most of the available closers on the waiver wire were in committee situations and couldn’t be trusted anyway.

I worked 1B, 2B, and 3B hard.  At one point I was trying to engineer a 3B trade, having Seager while he was hot and Arenado after he came off the D/L.  But my potential trade partners badly low-balled me for Beltre (offering guys who were worth far less than Beltre was) and suddenly Seager dropped off a cliff, making his trade value useless.  Eventually I dumped both.

1B pickups Napoli, Duda and especially Carter turned out to be huge winners.  Once again proving my point that some positions are just so deep they’re not worth drafting.  Same with outfielders to a certain extent; I had Ozuna all  year and he’s turned out to be well worth it.

My season’s end Fantasy team after all this waiver wire churning.  Bold are original, red are waiver wire:

  • C: Santana
  • 1B: Carter, Duda
  • 2B: Baez, Prado
  • SS: Betts
  • 3B: Beltre
  • OF: Stanton, Jones, Ozuna
  • SP: Hudson, Ryu, Odorizzi, Cole, Hellickson, Wood, Duffy, Liriano, Smyly
  • RP: Jansen, Holland

That’s a lot of red.

Lessons Learned for Next Year

  1. You only need two big-time closers to compete.  Spend draft picks in the 5th and 6th rounds, try to get a third closer later on and you’ll do fine.  You must do a better job on the waiver wire though trying to grab closers if you want them.
  2. There’s always 1B talent on waivers.  Do not over-spend on 1B.
  3. My strategy of over-loading on mediocre starters just doesn’t seem to be working.  I was 3rd in wins and 5th in Ks, but 8th in ERA, dead last in losses and 11th in whip.   Meanwhile the #1 team this year went with an uber-pitching strategy (over-drafting starters and ending up with Kershaw, Sale, Felix Hernandez as well as several top closers) and he just dominated pitching.  Despite having a ton of starters, he managed to be 4th in Wins AND be 2nd in Whip.  I think he’s got a good strategy.  And i’m sure people will try to emulate it next year.
  4. Do not sweat churning and burning waiver wire picks early on; you may just end up with a monster surprise player on the year.  This was the 1st place team’s strategy and it netted him Charlie Blackmon and a couple of extra closers.  Two of the top 10 starters on the year were waiver wire guys: Corey Kluber and Garrett Richard.
  5. Do not hesitate grabbing big-name call-ups.  I missed out on more than a couple guys that I would have grabbed but hesitated.  This cost me last year with Yasiel Puig and it cost me this year with Jorge Soler and George Springer.  I waited, and I missed out.

Blech.  Hope you enjoyed the rant.


Statistics, Deception and Boswell

11 comments

In case you weren't aware, Clayton Kershaw is really good.  Photo via wiki.

In case you weren’t aware, Clayton Kershaw is really good. Photo via wiki.

Was casually reading Tom Boswell‘s article in the post today (which can be summarized as “1,000 words on why you don’t want to face Clayton Kershaw in the playoffs, duh) and he posted the following intriguing statistic as part of his argument:

  • In games started by Kershaw, the Dodgers are 19-4
  • In games NOT started by Kershaw, the Dodgers are 59-58

Ergo, the Dodgers are really beatable when they don’t throw Kershaw.

This sounded like a great stat.  Until you dive a little deeper and you do the same analysis for our own first place/better record than the Dodgers team.

Los Angeles is, as of the moment of this writing, 78-62.  By starter, their team record breaks down like this:

  • Kershaw: 19-4
  • Ryu: 15-9
  • Greinke: 14-13
  • Haren: 13-14
  • Beckett: 9-11
  • Other randoms: 8-11

All others besides Kershaw and Ryu: 44-49
All others but Kershaw: 59-58

Pretty compelling, eh? They’re a losing team when not throwing one of their two aces in Kershaw or Hyun-jin Ryu.   Surprisingly, the team under their supposed #2 Zack Grienke sports just a .500 record on the year through 27 starts despite his known quality.


Lets do the same analysis for the Nationals, currently sporting a better record of 79-59 and having just beaten the Dodgers two out of three at their house.  Here’s the Nats team record under each starter this year:

  • Zimmerman: 19-9
  • Fister: 14-7
  • Gio: 13-10
  • Stras: 16-13
  • Roark: 15-12
  • Jordan: 1-4
  • Treinen: 1-4

All others besides Zimmermann and Fister: 46-43.

Hmm.  So, much like the Dodgers, if you play the Nats and you’re not facing one of OUR two best pitchers, we’re basically a .500 team.

I guess the point is this: in a sport where a team that is winning 57% of its games has the best record in the majors, the margins for winning and losing are pretty slim.  Or maybe the point is this: you can use stats to support pretty much whatever hypothesis you wish to postulate.

I think everyone knows that beating Kershaw is nearly impossible, and facing him twice in a short series may be the difference between advancing and going home.  But then again, this is the same Kershaw who has (believe it or not) a career 4.23 ERA in the post-season and got hammered by the Cardinals for 7 runs in 4 innings in last  year’s NLCS.   I guess that’s why they play the games.

But, I think it is also safe to say that the series in Los Angeles showed why it’d be one heck of an NLCS if the seedings held and the two top NL teams  held form in the divisional series.  Lets hope it comes to pass.

Post trade-deadline playoff contender rotations

2 comments

This year’s MLB trade deadline was crazy.  Never before have so many big-time names moved teams.  And certainly I cannot remember so many big-time pitchers relocating mid-season as well.

Lets look at the playoff contender rotations as they stand right now, with Trade deadline acquisitions highlighted in blue.

NL

  • Washington: Strasburg, Gonzalez, Zimmerman, Fister, Roark
  • Atlanta:  Teheran, Minor, Santana, Harang, Wood
  • Milwaukee: Lohse, Garza, Gallardo, Peralta, Nelson
  • Cincinnati: Cueto, Latos, Bailey, Leake, Simon
  • St. Louis: Wainwright, Masterson, Lackey, Lynn, Miller
  • Pittsburgh: Liriano, Morton, Locke, Volquez, Worley
  • Los Angeles: Kershaw, Greinke, Ryu, Beckett, Haren
  • San Francisco: Bumgarner, Hudson, Lincecum, Vogelsong, Peavy

St. Louis clearly did the most in the NL, acquiring two mid-rotation guys to help cover for the injured Michael Wacha and Jaime Garcia, but it is hard to look at their rotation and say they’d have the advantage over some of their potential playoff rivals.  San Francisco lost its ace (thought he hasn’t pitched like an Ace since signing his new deal) Matt Cain, and his replacement was not inspiring confidence (Yusmiero Petit), so they added former Cy Young winner Peavy (who is pitching better than his 1-11 W/L record .. but not a lot better).  Otherwise the NL playoff contenders mostly stood pat.  There was some small surprise that the free-spending Dodgers wouldn’t try to improve upon the suddenly underperforming Josh Beckett and/or the “fool-me-once” Dan Haren.  They’ll struggle to get through the #3 and #4 starts of their planned playoff rotation to get back to their co-aces Kershaw and Greinke (who was good but not shut-down in last year’s playoffs).  The home-town Nats may find themselves with an uncomfortable decision to make if they make the playoffs; which starter to send to the pen?  Roark is the least renound and the least tenured … but he has clearly been more effective than other rotation members.

It continues to amaze that the Braves are competing, given the losses they’ve faced in their rotation.  They are missing (arguably) their planned #2, #3 and #5 starters in Kris MedlenBrandon Beachy and Gavin Floyd but are getting by thanks to two mid-spring acquisitions (Santana and Harang) and the surprise performances of youngsters Wood and David Hale (who didn’t merit his demotion to the bullpen).

AL

  • Baltimore: Tillman, Norris, Chen, Gonzalez, Gausman
  • Toronto: Buehrle, Dickey, Happ, Strohman, Hutchinson
  • New York: Kuroda, Phelps, Capuano, Greene, McCarthy
  • Detroit: Scherzer, Verlander, Sanchez, Price, Porcello
  • Kansas City: Shields, Duffy, Ventura, Guthrie, Vargas
  • Oakland: Grey, Samardzija, Lester, Hammel, Kazmir
  • Los Angeles: Weaver, Wilson, Richards, Shoemaker, Santiago
  • Seattle: Hernandez, Iwakuma, Paxton, Elias, Young

I didn’t include fringe playoff contenders such as Cleveland or Tampa Bay here; both of those rotations were purged and weakened, and their odds of catching one of these listed WC contendors is long.  Oakland completely re-made their rotation here, attempting to keep up with Detroit, who now features the last three AL Cy Young winners to go along with Sanchez (who finished 4th last year in a season where he led the league in both ERA and FIP).  That’s quite a lineup.  Meanwhile Seattle likely finishes 10 games back of the Angels and could end up facing them in the coin-flip wild-card game … and could end up throwing the best pitcher in the AL at them (which has been noted as a significant down-side to the 2nd wild-card matchup; who wants to see a team lose out to a divisional rival that they bested by so many games in a play-in game?).

New York is the “Atlanta” of the AL this year; they currently have four planned rotation members on the D/L and (likely) out for the year (CC Sabathia, Ivan Nova, Michael Pineda and Masahiro Tanaka).   Their 4th and 5th starters were a 14th and 15th round pick respectively.  They’ve been outscored by nearly 30 runs on the year yet somehow have a winning record.  It seems like just a matter of time before their luck runs out and they settle back below .500.

Who would you rather go to war with, Detroit or Oakland’s rotation?   Probably Detroit’s rotation, given its depth one to four.  But the ALCS could be one heck of a series.


What’s eating Stephen Strasburg? Some stats and some thoughts

52 comments

Strasburg's  having a weird season. Photo unk via thewifehatessports.com

Strasburg’s having a weird season. Photo unk via thewifehatessports.com

Knee-jerk question: who is the best starter on the Washington Nationals?  Who do you call the team’s “Ace?”

For years its been Stephen Strasburg, even when Gio Gonzalez and Jordan Zimmermann were getting Cy Young votes (Gio 3rd place in 2012 and Jordan 7th place in 2013).  Its been Strasburg even when Zimmermann makes two consecutive all-star teams and the team acquires Doug Fister, who is 13th in the majors in accumulated fWAR over the past four seasons.  Its still Strasburg despite the fact that #5 starter (and someone who people in this space argued rather vociferously for “stashing” in AAA this year in lieu of other pitchers) Tanner Roark leads the team in victories right now.

(all stats on baseball-reference.com and/or fangraphs.com as of 7/31/14).

But this year, something is amiss with Strasburg.  He’s having a complete jeckyl-and-hyde season in many ways.  To wit;

  • He leads the starters in FIP and xFIP,  (indeed; among qualified starters right now in MLB, he’s 11th in FIP and 4th in xFIP, training just leading Cy Young favorites Clayton Kershaw, Felix Hernandez and Masahiro Tanaka).
  • He leads the Nats starters in fWAR.
  • He leads the NL in strikeouts with 10 more than his closest competitor Johnny Cueto.

I dunno.  If someone told me that a starting pitcher was leading the league in Ks, was 4th in xFIP, 11th in FIP and was 6th in velocity i’d say you had a pretty darn good pitcher.  But he’s been arguably the Nats *least* effective starter this year all in all.

Yet he’s just 7-9 on the season with a 3.55 ERA (one 1/100th of a point better than Zimmermann for last on the Nats rotation).   He has the worst WHIP of any of our starters at 1.240.  The team is just 11-12 in his starts.

So what the heck is going on?  Here’s some interesting statistical splits:

  • Compared to last year, his K/9 is up, his BB/9 is down.  That sounds good.  But his ground ball percentage is down and his line drive percentage is up.  Batters are putting better wood on the ball.  Which leads to…
  • His current BABIP against is an astoundingly high .345.  That’s the third highest BABIP of any qualified starter this year and a good 50 points higher than the league average.
  • Why are hitters getting such good wood on him?  Here’s a hint: for reasons unknown, batters are squaring up his fastballs like never before.  Checking his Pitch F/X data: he’s got a batting average against (BAA) of .294 on his four-seam fastball and an astounding .350 against his two-seam fastball.  Both of those figures are 50 points higher than the comparable BAA for those two pitches from 2013.
  • His velocity is down.  Which is kind of like saying that a model has gained a few pounds, but still.   Last years’ avg MPH on his two fastballs were 95.2 and 95.3.  This year?  94.5 and 94.6.  That’s just 7/10ths of a mph, and even with his loss of velocity he’s still easily in the top 10 in the league in average fastball velocity (6th in four seam velocity among starters), but its still declining.  In his 5 pro seasons his 4-seam average fastball velocity has gone from 97.6 to 96.0 to 95.8 to 95.2 to his current 94.5.

It sounds to me like a combination of slightly declined fastball velocity and some bad luck has led to hitters squaring up his fastballs more this year, resulting in more line drives, higher BABIP and more runs.  That more or less explains the huge delta between his ERA and his FIP.  But why?  Pitch F/X isn’t showing much of a change in fastball movement from last year to this year, so it is hard to argue that he’s lost movement on his fastball.  Could it all just be about location?

A couple more split-related observations (some of these we’ve seen during broadcasts):

  • Home ERA: 2.62.  Away ERA: 4.68.  Yeah, but lots of pitchers have big home/away splits.
  • First Inning ERA: 5.09!  Second Inning ERA: 4.30.  He’s getting hit early and often.
  • He’s improving as the game goes on; his stats against the order the second time through are significantly better than the first time through, something you don’t normally see.

If he’s so bad in the first inning, is he just having difficulties getting loose and finding his spots?  Is he falling behind and grooving fastballs and getting more line drive hits?  Why is he so significantly worse on the road?

On the bright side, the combination of an inflated BABIP and a huge delta between xFIP/FIP and his ERA does tend to indicate that there should be some regression back to the mean.  Maybe we’ll start seeing a bunch more of 7ip, 4hit, 2walk, 10K outings and he’ll break off a slew of dominant starts to help the Nats pull away in the division, just in time to lead the charge with a  home-field start in game 1 of the playoffs.

Thoughts?  Are you worried?  What else do you think is causing his troubles this year?

Pitcher Wins on the FA Market – 2014 edition with bWAR

leave a comment

Kershaw's new $30M/year contract will be tough to live up to.  Photo via wiki.

Kershaw’s new $30M/year contract will be tough to live up to. Photo via wiki.

One of my pet projects of recent years has been to track “major” Starting Pitcher free agent contracts and then to do analysis of how they turned out, on a Dollar per Win basis.  This post is an updated version of this analysis to determine some of the “best” and “worst” free agent contracts ever awarded to starting pitchers.  It is updated for 2014 from last year’s version of the post by my putting in all the 2013 data for pitchers, plus putting in the significant 2014 FA contracts.  And, per requests I have added in bWAR and $/bWAR for analysis (though, as we’ll soon see, $/bWAR can be tricky to interpret for really poor performing pitchers).

The raw data spreadsheet is available in Google Docs at this link, or along the side of this blog window in the NAR Creation links section.  I havn’t cut and pasted any of the data here because the spreadsheet is too “wide” for the blog; I suggest opening it up in a separate tab while reading this post.

Data Taxonomy/caveats: For ease of analysis, I depend on the Average Annual Value (AAV) of the contracts as opposed to trying to figure out exactly how many wins were earned in which year of a varying contract amount.  Therefore (for example), Gio Gonzalez‘s contract may have only paid him $3.25M in 2012 but I’m using the full AAV of $8.4M for the purposes of the analysis (it would just be far too difficult to calculate each pitcher’s dollar per win on an annualized basis otherwise).  This analysis focuses heavily on dollars per pitcher Win, despite the known limitations of the win stat.  There is also dollars per Quality Start and now dollars per bWAR (baseball-reference’s version of WAR).

Here’s some interesting facts, that come out of this analysis (some of these points can also be seen at the amazing Cots Salary database, now at Baseball Prospectus, and are confirmed in my spreadsheet tracking the same):

Largest total Starting Pitcher Contracts ever signed

  • Clayton Kershaw‘s new 7yr/$214M deal signed this past off-season.
  • It beats out the previous record holder (Felix Hernandez‘s  7 year, $175M extension) by nearly $40M in total value.
  • CC Sabathia (7yrs/$161M in 2009) was the longer-time previous record holder before that.
  • Zack Greinke (6yr/$147M)  and Cole Hamel‘s 6yr/$144M contract deserve mention.
  • Masahiro Tanaka signed one of the biggest ever deals (7 year $155M) before he ever threw a MLB pitch.

Largest Single-Season AAV

  • Kershaw’s new deal finally beats out Roger Clemen‘s long standing single season record 1yr/$28M deal in 2007 as the largest AAV pitcher contract.  
  • Justin Verlander‘s new deal gives him an AAV of $28M, a 10% jump up from the $24-$25M/year threshold deals we saw a number of pitchers sign in the last couple of years.

What are some of the Worst Deals ever made?  Lets talk about some of these awful deals on a $ per win or $ per bWAR basis.  Most of these contracts are well known to baseball fans and are commonly thrown around when talking about the worst historical FA contracts, but they’re fun to revisit.  Thanks to the bWAR inclusion, a number of new/more recent contracts now pop up on this list.

  • Kei Igawa‘s 2007 deal with the Yankees, which was 5yrs/$20M but included a $26M posting fee, is generally speaking the worst $AAV per Win contract ever signed.  Igawa went 2-4 in 13 starts over the life of this 5 year deal, equating to $23M per win for his team.  He made exactly one quality start, meaning the Yankees paid $46M per QS.He spent the last two seasons of this contract buried in AAA.   For their $46M, the Yankees got a combined -0.6 bWAR out of Igawa.
  • Chris Carpenter signed a 2yr/$21M extension in St. Louis before the 2012 season that seemed like a good deal at the time; unfortunately for both sides Carpenter hurt his shoulder, only made 3 starts in 2012, went 0-2 and contributed a -2.3 bWAR in that time.  So his dollars per win is infinite and his $/bWAR is uncalculatable.  I still rank Igawa’s deal as worse though since it cost his team more than double the dollars, and since Carpenter’s troubles were injury related while Igawa’s was mostly due to performance.
  • Jason Schmidt‘s 3yr/$47M contract with the Dodgers.  Schmidt made 10 total starts and went 3-6, equating to $15.6M per win.  He totaled a -0.5 bWAR during this 3 year contract.
  • Oliver Perez made just 21 starts (and got 3 wins in the duration of his 3 year/$36M contract with the Mets.  He was released in March of 2011, the final year of the contract, causing the Mets to eat $12M in salary.  The Nats picked him up and carried him on their AA roster all year before dumping him as well; he’s now trying to remake himself as a loogy and is in Arizona’s bullpen.
  • Matt Harrison‘s current deal (so far) has been pretty expensive for the Rangers: for $11M in salary in 2013 they got just two starts and two bad losses before he hit the D/L and missed the remainder of the season.  He still hasn’t returned.  Odds are he recovers and has a chance to earn this contract, but you never know with shoulder injuries (though to be fair the injury that cost him 2013 was a ruptured disk in his back).
  • Tim Lincecum‘s recently completed 2yr/$40.5M contract was pretty ugly for San Francisco; he went 20-29, had just a 43% Quality Start percentage and contributed -2.3 bWAR over those two seasons for his $40M.
  • Barry Zito signed a 7yr/$126M deal.  In those 7 years he went 63-80 and contributed just 3.0 bWAR in the lifetime of the contract.  That’s $42M per win.  By way of comparison, Tanner Roark‘s 5 weeks of effort for the Nats last summer totaled 2.0 wins.
  • Mike Hampton‘s injury plagued/ill conceived 7yr/$121M contract resulted in two full missed seasons and just a grand total 3.0 bWAR of value.
  • Edwin Jackson and Dan Haren both managed to put up negative bWAR for their 2013 seasons (for which they were both being paid $13M a piece).  But those are just one-year deals; they aren’t the multi-year disasters that these other contracts can be.
  • Chan Ho Park signed a 5yr/$65M deal with the Dodgers; for those $65M the Dodgers got precisely 0.2 total bWAR in 5 seasons.  That’s right; for that money they could have fielded a 4-A pitcher and gotten comparable value.  Park was 33-33 during that time and missed significant time with injury.
  • Darren Dreifort (6.1M/win and 0.2 bWAR in 5 seasons), Russ Ortiz (4.7M/win and -3.2 bWAR in 4 seasons), Carl Pavano ($4.4M/win and 0.4 bWAR in 4 seasons), and Carlos Silva ($4M/win and -0.7 bWAR in 5 seasons) all had pretty infamous contract disasters too.

How about some of the Best Contracts ever signed?  Lots of players have signed small one year deals and won double-digit games, so those really cannot count.   Starting with an arbitrary floor of a $50M free agent contract, here’s some of the best value FA contracts ever signed:

  • Pedro Martinez: 7yr/$92M, during which he went 117-37 for the Red Sox for a $786k/win total.
  • Justin Verlander‘s 5yr/$80M deal from 2010-2014 will be a steal for Detroit: he’s already contributed 25+ bWAR and is at about $888k/win.  The same probably will not be said about his mammoth $140M extension.
  • Mike Mussina went 92-53 in his 6yr/$88.5M contract for $961k/win.
  • Chris Carpenter‘s 4yr/$50.8M deal from 2008-2011 was a steal for St. Louis: He may have missed some time but he still went 44-23 during that contract, contributed 13.6 bWAR and his $/win number was just $1.1M.  He’s the only guy who appears in both the “best contracts” and “worst contracts” section in this post.
  • Mark Buehrle‘s 4yr/$56 deal from 2008-2011 resulted in about a $1M/win and just $3.2M/bWAR, great value for his team despite his mediocre looking 54-44 record.
  • Jered Weaver, Yu Darvish, and Hyun-Jin Ryu deserve  mention here; they’re all in the early stages of their long-term contracts and are easily providing value in terms of $/win.

So what does this data mean?  Here’s some conclusions when talking about Dollars per Pitcher Win.

  1. Up to perhaps the mid 2000s, if you got about one (1) pitcher Win per million dollars spent on a player in the Free Agent market that you were doing great.
  2. Now, if you’re getting anything under $1.5M per win, you should be happy.  Especially if you’re paying an ace $25-$30M/year.
  3. Anything over $2M/win is usually considered a bust.  Nearly every contract in the $2M/win in AAV and above has been mentioned and criticized as being a bad contract; the list of “worst ever” above starts at $4M/win and goes higher.
  4. If you pay a starter anything more than about $25M/season,  you’re really going to have a hard time getting value back.  There’s only been a handful of 20-game winners over the past 5 years or so, but paying a starter $24M like Greinke is getting is almost certainly going to be regretted at some point.  An injury or a lost season completely blows the $AAV/win.
  5. It illustrates more clearly than anywhere else the value of a top-notch, pre-Arbitration starter.  Take Clay Buchholz for example; in 2010 he was 17-7 while earning the league minimum of $443k.  That equates to $26,059/win on the same staff that was busy paying Daisuke Matsuzaka $2.06M per win (when adding in the $52M posting fee).  Buchholz has struggled with injuries since then, but teams that  lock down and depend on these pre-arb starters save untold amounts of FA dollars as a result.
  6. This analysis is nearly impossible to do across baseball eras because of the general inflation of contracts and especially because of the bonanza of FA dollars being thrown out there right now.  Pedro Martinez at the top of his game signed a 7yr/$92M deal.  Imagine what he’d get today?  It could be three times that considering how good he was in comparison to his counterparts in the mid 90s.  He was coming off a 1997 season in which he struck out 305 batters, had a 1.90 ERA, a 219 ERA+ and won the Cy Young award.  So going forward a general $1.25M/win is a more accurate barometer for whether or not a pitcher has “earned” his contract.  But there’s no easy way to draw a line in the free agency sand and say that before yearX $1M/win was a good barometer while after yearY $1.25M/win is a good barometer.
  7. A caveat to the $1M/win benchmark; there are different standards for obtaining wins.   If you sign a $3M 1 year deal and then subsequently go 3-12 with a 6.00 ERA … while it looks like you reached the $1m/win threshold in reality you were, well, awful.  This analysis only really holds up for major FA contracts paying in excess of $10M/year.

And here’s some discussions on Dollars per WAR, since we’ve added that in for this 2014 analysis.

  1. The general rule of thumb is that “wins” in terms of WAR “cost” is somewhere between $6M and $7M on the open market.  Did $6M/win work out in this analysis?  Yes and no; it is sort of difficult to do this analysis with players badly underperformed.  Take for example John Danks: he’s two years into a 5yr/$65M contract where he’s gotten hurt in both seasons and has just 7 wins and a 0.7 bWAR.  Well, $26M in total salary paid so far for 0.7 bWAR equals a $37M/war figure.  Well that’s not quite right.
  2. The best you can do is look at player-by-player examples.  Johan Santana‘s 6yr/$137.5M contract cost his team $9M/bWAR.  That’s unquestionably bad.   Cole Hamels went 17-6 in 2012 on a 1yr/$15M deal, which turned out to be just $3.2M per WAR for his 4.2 bWAR season.  That’s great.
  3. The $/bWAR analysis gets worse if the bWAR is negative; our own Dan Haren came in with a -0.01 bWAR for 2013; how do you decide how much the Nationals paid on a dollar-per-bWAR basis for Haren?  If you divide 0.01 into his $13M salary you get a non-sensical -$1.3 billion figure.


Lastly, for comparison purposes, here’s the above analysis looks for the 2013 Nationals pitching staff.  Keep in mind that the $/win figures for pre-arbitration pitchers vastly skew the analysis (apologies if this bleeds off the side of the browser screen)

Last Name First Name Total Value (includes guaranteed $) $$/year AAV Contract Term Years Into Contract Starts QS QS % W L $ per start $ per QS $ AAV per win Total bWAR $ per bWAR
Strasburg Steven $19,000,000 $4,750,000 2009-13 5 75 46 61.3% 29 19 $316,667 $516,304 $818,966 8.5 $2,794,118
Gonzalez Gio $42,000,000 $8,400,000 2012-16 2 64 43 67.2% 32 16 $262,500 $390,698 $525,000 7.9 $2,126,582
Zimmermann Jordan $5,350,000 $5,350,000 2013 1 32 21 65.6% 19 9 $167,188 $254,762 $281,579 3.7 $1,445,946
Detwiler Ross $2,337,500 $2,337,500 2013 1 13 6 46.2% 2 7 $179,808 $389,583 $1,168,750 0.1 $23,375,000
Haren Dan $13,000,000 $13,000,000 2013 1 30 15 50.0% 10 14 $433,333 $866,667 $1,300,000 0.0 (0 war)
Maya Yunesky $8,000,000 $2,000,000 2010-13 4 10 1 10.0% 1 4 $800,000 $8,000,000 $8,000,000 -0.8 ($10,000,000)
Karns Nathan 490,000 490,000 2013 1 3 0 0.0% 0 1 $163,333 (0 QS) (0 wins) -0.4 ($1,225,000)
Jordan Taylor 490,000 490,000 2013 1 9 3 33.3% 1 3 $54,444 $163,333 $490,000 0.0 (0 war)
Ohlendorf Ross 1,000,000 1,000,000 2013 1 7 3 42.9% 3 1 $142,857 $333,333 $333,333 0.9 $1,111,111
Roark Tanner 490,000 490,000 2013 1 5 4 80.0% 3 1 $98,000 $122,500 $163,333 2.0 $245,000

The counting figures for Starts/QS/Wins/Losses are cumulative for the life of whatever contract the player is on.  So for Strasburg, he was basically in the 5th year of his original 5 year deal, hence the 75 total starts in those 5 years.

The 2013 Nats have $AAV per win and $/bWAR mostly on the good side:

  • Yunesky Maya and Nathan Karns both contributed negative bWAR for 2013, so their numbers are meaningless.
  • Taylor Jordan and Dan Haren both came in at zero (or close enough to it) bWAR, so their numbers are also meaningless.  Well, not “meaningless” in Haren’s case: basically he gave the team replacement performance for his $13M in salary; the team could have just called up a guy from AAA and let him pitch all year and gotten about the same value.  Thanks for the memories!
  • The best $/win guy was Tanner Roark, who got 3 wins for his MLB minimum salary … and that’s not even taking into account the fact that Roark’s 2013 salary probably should be pro-rated for this analysis.
  • The worst $/win guy was  Maya; who demonstrated yet again that his $8M contract was a mistake.
  • Nearly the entire staff has $/win values under the “you’re doing well” threshold of $1M/win.  And nearly the whole squad is doing $/bWAR well below the $6M/bWAR range.


Yordano Ventura: MLB’s newest velocity revalation

8 comments

Ventura has some serious heat.  Poto Mandatory Credit: Brad Penner-USA TODAY Sports

Ventura has some serious heat. Poto Mandatory Credit: Brad Penner-USA TODAY Sports

I present to you without further ado Kansas City’s Yordano Ventura‘s Pitch F/X stats from last night’s MLB debut start.

According to Pitch F/X, he threw 45 fastballs on the night with an AVERAGE velocity of 99.5mph, peaking at an absurd 102.9mph on one of the final pitches he threw as he finished off 6 shutout innings against the Rays.  He’s 5’11” and 180 soaking wet.

Lest you think he only has one pitch, he has a sick 89mph change with circle action (i.e., coming back in against righties); he threw 19 of them last night and 13 of those 19 change ups were “SNIPs,” or “Strikes not in play.”  In other words … exactly what a pitcher wants.   He only gave up one ball-in-play on his changeup the entire night.  He also featured a curve that has somewhere in the 16mph range difference from his fastballs (by way of comparison, everyone raves about guys like Strasburg and Kershaw‘s fb-curve deltas, as I talked about in this post from last year, and Ventura is right up there).   He threw a 4th pitch (a cutter in the 96-98mph range) but its awfully hard to tell if it had much action on it, or which pitches Pitch F/X thought were cutters versus just him taking a couple MPH off his fastball.

Fun to watch, absolutely.  Lets hope he’s not a TJ-surgery in waiting.

Written by Todd Boss

April 9th, 2014 at 9:17 am

Obligatory 2014 MLB Prediction piece

9 comments

Predicted Division Winners and why:

  • NL East: Washington.  I thought it was going to be a close race in 2014 until Atlanta lost 3/5ths of their rotation.  The rest of the division is awful; there could be a 20 game gap between 2nd and third place.
  • NL Central: St. Louis.  What they lost in offense via FA they’ve more than made up for in their off-season acquisitions, plus they replace Jake Westbrook‘s awful starts with Michael Wacha‘s potentially ace-level starts.  No reason they’re letting off the gas now.  The best organization in the game.
  • NL West: Los Angeles Dodgers.  Essentially the same team that ripped off a 42-8 streak last year, and they can only get better when injured super stars like Matt Kemp and Chad Billingsly come back from injury.  Can and will buy whatever they need to stay on top.
  • AL East: Tampa. Lots of people are trendy-picking Tampa … and I think Tampa’s improved for sure.  But Boston hasn’t exactly regressed, and they won the most games in the sport last year to go along with the WS crown.  Boston has replaced key veterans with uber-prospects, who could go either way.  Meanwhile Tampa is rolling out basically the same team that would have won any other division easily, they kept David Price, and they’re getting a full season out of ROY Wil Myers.   I see this race going down to the wire with Tampa winning it.
  • AL Central: Detroit hangs on for another year, despite some curious personnel moves this off-season.  It helps to have two of the best arms and the best hitter in the game.  But it’ll be much closer over Kansas City and Cleveland than they want, thanks to
  • AL West: OaklandTexas can’t go 48 hours without losing another player to injury.  The Angels have half a rotation and a bunch of overpaid underperforming sluggers on their team.  Seattle spent hundreds of millions of dollars in the off-season so they can lose 85 games again.  And Houston remains a laughing stock; they’ll be pressed to win 60 games again.  Oakland’s got as many SP injuries as Texas … but also has Billy Beane at the helm and he’s always ready to make a move.

Wild Cards

  • NL: Atlanta and Cincinnati: Atlanta may have lost a lot of their rotation … but Minor’s only out a month and the kids they’re throwing out there may be able to tread water.  Atlanta’ still has the same offense basically that bashed their way to 96 wins.  But it’ll be close.  Meanwhile I see both Cincinnati and Pittsburgh taking steps back.  The question will be who steps back furthest.  Cincinnati lost some offense but replace it with a potential 100-steals guy who’s a defensive whiz in center; it could be a net gain on both sides of the ball.  Meanwhile Pittsburgh mostly stood pat, letting their #2 pitcher walk away and replaced him with a guy who was flat out released last year by one of the worst teams in the game (Edinson Volquez).  Maybe he’s just a place holder for Jamison Taillon … but that’s still 2 months of potential 6.00 ERA/bullpen sapping performances coming their way.   The Pittsburgh fans have to be somewhat dismayed that their 90+ win team did basically nothing to maintain their competitiveness the following year.   There’s not another team close in the NL: Arizona was a .500 team but they seem like they’ll be at best a couple games better, but not enough to be in the discussion.  Does anyone think the Giants are winning 15 more games this year than last?   Perhaps Milwaukee could make some noise and get into the race; that’d be my dark horse.
  • AL: Boston and Kansas City: Tampa’s a great team and may very well switch places with the Red Sox as division champs, but for now we’re predicting that Boston has lost *just* enough to lose the division.  Meanwhile I think KC finally makes the leap.  They had last  year to improve; this year they gel and overtake Cleveland in the division.  They’re going to press Detroit (who always seems better than their record; how do they *only* win 93 games last year with the pitching and hitting they had?).

Its folly enough to do divisional predictions on day one of the season … even more so to predict who will finish with the best records and thus predict who gets the wild cards.  But i’ll give it a shot.  In the AL: Tampa, Detroit, Oakland in that order of victories, meaning Tampa gets the WC winner.  In the NL: Los Angeles, St. Louis and then Washington, meaning LA gets the wild card and StL would have home-field over the Nats.

Playoff Predictions:

  • NL play-in: Cincinnati has the better big-game pitcher and squeaks out one against Atlanta
  • AL play-in: Kansas City may have gotten there … but they’re not in the post-season for long as Boston bashes them to make the
  • NL Divisional Series: St. Louis outlasts Washington in a heart-breaking revisit to the 2012 NLCS.  Los Angeles pummels the ace-less Reds behind their own 1-2 punch of Kershaw and Greinke.
  • AL Divisional Series: Tampa outlasts Boston in a 5-game tear-jerker, while Detroit beats out Oakland in a complete re-peat of 2013’s playoff series.
  • NLCS: Los Angeles  solves St. Louis’s pitching staff enough to win the Pennant.
  • ALCS: Tampa gets the better of Detroit’s aces.
  • World Series: NL over AL: Los Angeles’ spending pays off with a 6-game victory over Tampa.


Opening Day Starter Trivia – Updated for 2014

one comment

CC Sabathia continues to be the active leader in Opening Day starts. Photo via wiki/flickr.

Some of my favorite trivia questions  revolves around Opening Day Starters.  With another Opening Day in the books, here’s some useless trivia related to Opening Day starters.  I’ve updated my Opening Day Starters spreadsheet to Google Docs and created a link in the “Nationals Arm Race creation” section along the right.  Fyi, on a team-by-team basis you can query Baseball-Reference.com for the opening day lineups (here’s the Washington/Montreal franchise’ opening day lineup history as an example).

Current Active Leaders in Opening Day Starts

11 CC Sabathia
9 Mark Buehrle
7 Felix Hernandez
7 Justin Verlander
6 Bartolo Colon
6 Tim Hudson
6 Jered Weaver
6 James Shields
5 Josh Beckett
5 Yovanni Gallardo
4 Jake Peavy
4 Tim Lincecum
4 Clayton Kershaw
4 Jon Lester
3 Strasburg, Cueto, Wainwright, Price, Masterson, Nolasco
2 Lee, Samardzija, Liriano, Dickey, Sale, Feldman

Those players bolded in the list above had 2014 opening day starts and added to their totals.   (Note; there’s plenty of guys out there with 2 or 3 opening day starts but who did not extend their count in 2014; they are not included here).  With the retirement of Roy HalladayCC Sabathia extends his active lead in this category.  Mark Buehrle has given over the reigns of opening day starter possibly for good, based on his standing in the Toronto rotation.  Meanwhile the next closest competitors (Justin Vernalder and Felix Hernandez) could eventually supplant Sabathia, especially if he continues to struggle and gets replaced as the Yankees’ ace.

Felix Hernandez and Justin Verlander continue to be the best bets to broach the all-time records (see below) based on their ages, their current counts and their new long-term contracts.

Answers to other Opening Day start trivia:

Current Active Leader in consecutive Opening Day Starts: Sabathia with 9 consecutive, split among two teams.  Second is Verlander with 7 straight, albeit all with the same team.  There was talk about how his Cy Young-winning rotation mate Max Scherzer should have gotten the ball this year, given Verlander’s 2013 struggles.

Most ever Opening Day Starts all-timeTom Seaver with 16 in his career.

Most ever Consecutive Opening Day Starts: Hall of Fame lightning rod Jack Morris, who made 14 straight such starts.

Number of first-time opening day starters in 2014: Ten (10) guys got the ball on opening day for the first time, slightly down from last year’s 13.  Injuries gave some pitchers the ball on opening day over other expected rotation mates (this is definitely the case with the likes of Julio Teheran, Tanner ScheppersSonny Gray, Dillon Gee, Jorge De La Rosa), and its probably the case that others got the ball on opening day thanks to their own personal ascention to the “lead-dog” spot on their teams (Jose Fernandez, Madison Bumgarner).  The other three newbies (Andrew CashnerWade Miley, and Chris Tillman) probably fall somewhere inbetween these categories.

Who seems most likely to break Seaver or Morris’ Records at this point? Still Sabathia, who already has 11 opening day starts (and 9 straight), is the #1 in New York, is only 32 and still has four years on his current deal. However, he took a big step backwards in 2013 performance-wise, and the Yankees spent a ton of money on Masahiro Tanaka, and there could be a passing of the torch if Tanaka blows it out in 2014.  Meanwhile Hernandez already has 7 opening day starts, just signed a deal that takes him through 2019 with a relatively easy option for 2020.   That’s many more seasons under contract and he’d only be 34 years of age by its end.   He could be the standard holder if he stays healthy and continues to pitch like an ace.

Most Inconsisent team using Opening Day Pitchers: Oakland.  They’ve used 9 different opening day starters in the last 9 seasons, and that’s likely to continue since both the candidates for this year had injuries that forced them to go to a rookie for 2014.  Pittsburgh is right behind them;  they have used 7 different opening day starters in the last 7 seasons, and 13 different starters in the last 15 seasons. The Nats have at some point employed no less than three former Pittsburgh opening day starters: Ron Villone, Oliver Perez and Zach Duke.   Colorado, Baltimore and Minnesota have also struggled for most of the past decade to find a dominant, reliable “Ace” and constantly cycle through new opening day starters, and once again each is using a different guy in 2014.


My 2014 Fantasy Baseball Team

2 comments

Adam Jones; my #1 fantasy draft pick in 2014.  Photo unk.

Adam Jones; my #1 fantasy draft pick in 2014. Photo unk.

As with years past … feel free to skip this post if you don’t care about fantasy.  I know for certain that reading about someone elses’s fantasy sports team can be a bit grating.  But, if you do play fantasy i’m sure you’ll at least appreciate reading the selections and then looking at the team’s strength analysis at the end.

I’ll include a jump line so your RSS feeds aren’t blown out either.

Read the rest of this entry »

2014 Rotation Rankings 1-30

8 comments

The ace on the best rotation in the game.  Photo: talksportsphilly.com

The ace on the best rotation in the game. Photo: talksportsphilly.com

Last year, with my excitement over Washington’s Dan Haren signing and my supposition that Washington had the best rotation in the game, I ranked all 30 team’s rotations ahead of the 2013 season.  Then, after the season was done, I revisited these pre-season rankings with a post-mortem to see how close (or, more appropriately, how far off) my rankings turned out to be.

Here’s the 2014 version of this same post: Pre-season rankings of the MLB’s rotations; 1 through 30.  Warning; this is another huge post.  I guess I’m just verbose.  At this point midway through Spring Training there’s just a couple of possible FAs left that could have altered these rankings (Ervin Santana being the important name unsigned right now), so I thought it was time to publish.

The top teams are easy to guess; once you get into the 20s, it becomes pretty difficult to distinguish between these teams.  Nonetheless, here we go (I heavily depended on baseball-reference.com and mlbdepthcharts.com for this post, along with ESPN’s transaction list per team and Baseball Prospectus’ injury reports for individual players).

Read the rest of this entry »

Written by Todd Boss

March 10th, 2014 at 9:50 am

Posted in Majors Pitching

Tagged with , , , , , , , , , , , , , , , , , , , , , , , , , , , , , , , , , , , , , , , , , , , , , , , , , , , , , , , , , , , , , , , , , , , , , , , , , , , , , , , , , , , , , , , , , , , , , , , , , , , , , , , , , , , , , , , , , , , , , , , , , , , , , , , , , , , , , , , , , , , , , , , , , , , , , , , , , , , , , , , , , , , , , , , , , , , , , , , , , , , , , , , , , , , , , , , , , , , , , , , , , , , , , , , , , , , , , , , , , , , , , , , , , , , , , , , , , , , , , , , , , , , , , , , , , ,