Nationals Arm Race

"… the reason you win or lose is darn near always the same – pitching.” — Earl Weaver

Archive for the ‘stephen strasburg’ tag

Pitcher Wins on the FA Market – 2014 edition with bWAR

leave a comment

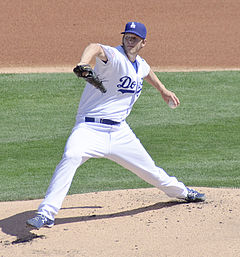
Kershaw's new $30M/year contract will be tough to live up to.  Photo via wiki.

Kershaw’s new $30M/year contract will be tough to live up to. Photo via wiki.

One of my pet projects of recent years has been to track “major” Starting Pitcher free agent contracts and then to do analysis of how they turned out, on a Dollar per Win basis.  This post is an updated version of this analysis to determine some of the “best” and “worst” free agent contracts ever awarded to starting pitchers.  It is updated for 2014 from last year’s version of the post by my putting in all the 2013 data for pitchers, plus putting in the significant 2014 FA contracts.  And, per requests I have added in bWAR and $/bWAR for analysis (though, as we’ll soon see, $/bWAR can be tricky to interpret for really poor performing pitchers).

The raw data spreadsheet is available in Google Docs at this link, or along the side of this blog window in the NAR Creation links section.  I havn’t cut and pasted any of the data here because the spreadsheet is too “wide” for the blog; I suggest opening it up in a separate tab while reading this post.

Data Taxonomy/caveats: For ease of analysis, I depend on the Average Annual Value (AAV) of the contracts as opposed to trying to figure out exactly how many wins were earned in which year of a varying contract amount.  Therefore (for example), Gio Gonzalez‘s contract may have only paid him $3.25M in 2012 but I’m using the full AAV of $8.4M for the purposes of the analysis (it would just be far too difficult to calculate each pitcher’s dollar per win on an annualized basis otherwise).  This analysis focuses heavily on dollars per pitcher Win, despite the known limitations of the win stat.  There is also dollars per Quality Start and now dollars per bWAR (baseball-reference’s version of WAR).

Here’s some interesting facts, that come out of this analysis (some of these points can also be seen at the amazing Cots Salary database, now at Baseball Prospectus, and are confirmed in my spreadsheet tracking the same):

Largest total Starting Pitcher Contracts ever signed

  • Clayton Kershaw‘s new 7yr/$214M deal signed this past off-season.
  • It beats out the previous record holder (Felix Hernandez‘s  7 year, $175M extension) by nearly $40M in total value.
  • CC Sabathia (7yrs/$161M in 2009) was the longer-time previous record holder before that.
  • Zack Greinke (6yr/$147M)  and Cole Hamel‘s 6yr/$144M contract deserve mention.
  • Masahiro Tanaka signed one of the biggest ever deals (7 year $155M) before he ever threw a MLB pitch.

Largest Single-Season AAV

  • Kershaw’s new deal finally beats out Roger Clemen‘s long standing single season record 1yr/$28M deal in 2007 as the largest AAV pitcher contract.  
  • Justin Verlander‘s new deal gives him an AAV of $28M, a 10% jump up from the $24-$25M/year threshold deals we saw a number of pitchers sign in the last couple of years.

What are some of the Worst Deals ever made?  Lets talk about some of these awful deals on a $ per win or $ per bWAR basis.  Most of these contracts are well known to baseball fans and are commonly thrown around when talking about the worst historical FA contracts, but they’re fun to revisit.  Thanks to the bWAR inclusion, a number of new/more recent contracts now pop up on this list.

  • Kei Igawa‘s 2007 deal with the Yankees, which was 5yrs/$20M but included a $26M posting fee, is generally speaking the worst $AAV per Win contract ever signed.  Igawa went 2-4 in 13 starts over the life of this 5 year deal, equating to $23M per win for his team.  He made exactly one quality start, meaning the Yankees paid $46M per QS.He spent the last two seasons of this contract buried in AAA.   For their $46M, the Yankees got a combined -0.6 bWAR out of Igawa.
  • Chris Carpenter signed a 2yr/$21M extension in St. Louis before the 2012 season that seemed like a good deal at the time; unfortunately for both sides Carpenter hurt his shoulder, only made 3 starts in 2012, went 0-2 and contributed a -2.3 bWAR in that time.  So his dollars per win is infinite and his $/bWAR is uncalculatable.  I still rank Igawa’s deal as worse though since it cost his team more than double the dollars, and since Carpenter’s troubles were injury related while Igawa’s was mostly due to performance.
  • Jason Schmidt‘s 3yr/$47M contract with the Dodgers.  Schmidt made 10 total starts and went 3-6, equating to $15.6M per win.  He totaled a -0.5 bWAR during this 3 year contract.
  • Oliver Perez made just 21 starts (and got 3 wins in the duration of his 3 year/$36M contract with the Mets.  He was released in March of 2011, the final year of the contract, causing the Mets to eat $12M in salary.  The Nats picked him up and carried him on their AA roster all year before dumping him as well; he’s now trying to remake himself as a loogy and is in Arizona’s bullpen.
  • Matt Harrison‘s current deal (so far) has been pretty expensive for the Rangers: for $11M in salary in 2013 they got just two starts and two bad losses before he hit the D/L and missed the remainder of the season.  He still hasn’t returned.  Odds are he recovers and has a chance to earn this contract, but you never know with shoulder injuries (though to be fair the injury that cost him 2013 was a ruptured disk in his back).
  • Tim Lincecum‘s recently completed 2yr/$40.5M contract was pretty ugly for San Francisco; he went 20-29, had just a 43% Quality Start percentage and contributed -2.3 bWAR over those two seasons for his $40M.
  • Barry Zito signed a 7yr/$126M deal.  In those 7 years he went 63-80 and contributed just 3.0 bWAR in the lifetime of the contract.  That’s $42M per win.  By way of comparison, Tanner Roark‘s 5 weeks of effort for the Nats last summer totaled 2.0 wins.
  • Mike Hampton‘s injury plagued/ill conceived 7yr/$121M contract resulted in two full missed seasons and just a grand total 3.0 bWAR of value.
  • Edwin Jackson and Dan Haren both managed to put up negative bWAR for their 2013 seasons (for which they were both being paid $13M a piece).  But those are just one-year deals; they aren’t the multi-year disasters that these other contracts can be.
  • Chan Ho Park signed a 5yr/$65M deal with the Dodgers; for those $65M the Dodgers got precisely 0.2 total bWAR in 5 seasons.  That’s right; for that money they could have fielded a 4-A pitcher and gotten comparable value.  Park was 33-33 during that time and missed significant time with injury.
  • Darren Dreifort (6.1M/win and 0.2 bWAR in 5 seasons), Russ Ortiz (4.7M/win and -3.2 bWAR in 4 seasons), Carl Pavano ($4.4M/win and 0.4 bWAR in 4 seasons), and Carlos Silva ($4M/win and -0.7 bWAR in 5 seasons) all had pretty infamous contract disasters too.

How about some of the Best Contracts ever signed?  Lots of players have signed small one year deals and won double-digit games, so those really cannot count.   Starting with an arbitrary floor of a $50M free agent contract, here’s some of the best value FA contracts ever signed:

  • Pedro Martinez: 7yr/$92M, during which he went 117-37 for the Red Sox for a $786k/win total.
  • Justin Verlander‘s 5yr/$80M deal from 2010-2014 will be a steal for Detroit: he’s already contributed 25+ bWAR and is at about $888k/win.  The same probably will not be said about his mammoth $140M extension.
  • Mike Mussina went 92-53 in his 6yr/$88.5M contract for $961k/win.
  • Chris Carpenter‘s 4yr/$50.8M deal from 2008-2011 was a steal for St. Louis: He may have missed some time but he still went 44-23 during that contract, contributed 13.6 bWAR and his $/win number was just $1.1M.  He’s the only guy who appears in both the “best contracts” and “worst contracts” section in this post.
  • Mark Buehrle‘s 4yr/$56 deal from 2008-2011 resulted in about a $1M/win and just $3.2M/bWAR, great value for his team despite his mediocre looking 54-44 record.
  • Jered Weaver, Yu Darvish, and Hyun-Jin Ryu deserve  mention here; they’re all in the early stages of their long-term contracts and are easily providing value in terms of $/win.

So what does this data mean?  Here’s some conclusions when talking about Dollars per Pitcher Win.

  1. Up to perhaps the mid 2000s, if you got about one (1) pitcher Win per million dollars spent on a player in the Free Agent market that you were doing great.
  2. Now, if you’re getting anything under $1.5M per win, you should be happy.  Especially if you’re paying an ace $25-$30M/year.
  3. Anything over $2M/win is usually considered a bust.  Nearly every contract in the $2M/win in AAV and above has been mentioned and criticized as being a bad contract; the list of “worst ever” above starts at $4M/win and goes higher.
  4. If you pay a starter anything more than about $25M/season,  you’re really going to have a hard time getting value back.  There’s only been a handful of 20-game winners over the past 5 years or so, but paying a starter $24M like Greinke is getting is almost certainly going to be regretted at some point.  An injury or a lost season completely blows the $AAV/win.
  5. It illustrates more clearly than anywhere else the value of a top-notch, pre-Arbitration starter.  Take Clay Buchholz for example; in 2010 he was 17-7 while earning the league minimum of $443k.  That equates to $26,059/win on the same staff that was busy paying Daisuke Matsuzaka $2.06M per win (when adding in the $52M posting fee).  Buchholz has struggled with injuries since then, but teams that  lock down and depend on these pre-arb starters save untold amounts of FA dollars as a result.
  6. This analysis is nearly impossible to do across baseball eras because of the general inflation of contracts and especially because of the bonanza of FA dollars being thrown out there right now.  Pedro Martinez at the top of his game signed a 7yr/$92M deal.  Imagine what he’d get today?  It could be three times that considering how good he was in comparison to his counterparts in the mid 90s.  He was coming off a 1997 season in which he struck out 305 batters, had a 1.90 ERA, a 219 ERA+ and won the Cy Young award.  So going forward a general $1.25M/win is a more accurate barometer for whether or not a pitcher has “earned” his contract.  But there’s no easy way to draw a line in the free agency sand and say that before yearX $1M/win was a good barometer while after yearY $1.25M/win is a good barometer.
  7. A caveat to the $1M/win benchmark; there are different standards for obtaining wins.   If you sign a $3M 1 year deal and then subsequently go 3-12 with a 6.00 ERA … while it looks like you reached the $1m/win threshold in reality you were, well, awful.  This analysis only really holds up for major FA contracts paying in excess of $10M/year.

And here’s some discussions on Dollars per WAR, since we’ve added that in for this 2014 analysis.

  1. The general rule of thumb is that “wins” in terms of WAR “cost” is somewhere between $6M and $7M on the open market.  Did $6M/win work out in this analysis?  Yes and no; it is sort of difficult to do this analysis with players badly underperformed.  Take for example John Danks: he’s two years into a 5yr/$65M contract where he’s gotten hurt in both seasons and has just 7 wins and a 0.7 bWAR.  Well, $26M in total salary paid so far for 0.7 bWAR equals a $37M/war figure.  Well that’s not quite right.
  2. The best you can do is look at player-by-player examples.  Johan Santana‘s 6yr/$137.5M contract cost his team $9M/bWAR.  That’s unquestionably bad.   Cole Hamels went 17-6 in 2012 on a 1yr/$15M deal, which turned out to be just $3.2M per WAR for his 4.2 bWAR season.  That’s great.
  3. The $/bWAR analysis gets worse if the bWAR is negative; our own Dan Haren came in with a -0.01 bWAR for 2013; how do you decide how much the Nationals paid on a dollar-per-bWAR basis for Haren?  If you divide 0.01 into his $13M salary you get a non-sensical -$1.3 billion figure.


Lastly, for comparison purposes, here’s the above analysis looks for the 2013 Nationals pitching staff.  Keep in mind that the $/win figures for pre-arbitration pitchers vastly skew the analysis (apologies if this bleeds off the side of the browser screen)

Last Name First Name Total Value (includes guaranteed $) $$/year AAV Contract Term Years Into Contract Starts QS QS % W L $ per start $ per QS $ AAV per win Total bWAR $ per bWAR
Strasburg Steven $19,000,000 $4,750,000 2009-13 5 75 46 61.3% 29 19 $316,667 $516,304 $818,966 8.5 $2,794,118
Gonzalez Gio $42,000,000 $8,400,000 2012-16 2 64 43 67.2% 32 16 $262,500 $390,698 $525,000 7.9 $2,126,582
Zimmermann Jordan $5,350,000 $5,350,000 2013 1 32 21 65.6% 19 9 $167,188 $254,762 $281,579 3.7 $1,445,946
Detwiler Ross $2,337,500 $2,337,500 2013 1 13 6 46.2% 2 7 $179,808 $389,583 $1,168,750 0.1 $23,375,000
Haren Dan $13,000,000 $13,000,000 2013 1 30 15 50.0% 10 14 $433,333 $866,667 $1,300,000 0.0 (0 war)
Maya Yunesky $8,000,000 $2,000,000 2010-13 4 10 1 10.0% 1 4 $800,000 $8,000,000 $8,000,000 -0.8 ($10,000,000)
Karns Nathan 490,000 490,000 2013 1 3 0 0.0% 0 1 $163,333 (0 QS) (0 wins) -0.4 ($1,225,000)
Jordan Taylor 490,000 490,000 2013 1 9 3 33.3% 1 3 $54,444 $163,333 $490,000 0.0 (0 war)
Ohlendorf Ross 1,000,000 1,000,000 2013 1 7 3 42.9% 3 1 $142,857 $333,333 $333,333 0.9 $1,111,111
Roark Tanner 490,000 490,000 2013 1 5 4 80.0% 3 1 $98,000 $122,500 $163,333 2.0 $245,000

The counting figures for Starts/QS/Wins/Losses are cumulative for the life of whatever contract the player is on.  So for Strasburg, he was basically in the 5th year of his original 5 year deal, hence the 75 total starts in those 5 years.

The 2013 Nats have $AAV per win and $/bWAR mostly on the good side:

  • Yunesky Maya and Nathan Karns both contributed negative bWAR for 2013, so their numbers are meaningless.
  • Taylor Jordan and Dan Haren both came in at zero (or close enough to it) bWAR, so their numbers are also meaningless.  Well, not “meaningless” in Haren’s case: basically he gave the team replacement performance for his $13M in salary; the team could have just called up a guy from AAA and let him pitch all year and gotten about the same value.  Thanks for the memories!
  • The best $/win guy was Tanner Roark, who got 3 wins for his MLB minimum salary … and that’s not even taking into account the fact that Roark’s 2013 salary probably should be pro-rated for this analysis.
  • The worst $/win guy was  Maya; who demonstrated yet again that his $8M contract was a mistake.
  • Nearly the entire staff has $/win values under the “you’re doing well” threshold of $1M/win.  And nearly the whole squad is doing $/bWAR well below the $6M/bWAR range.
 

If Hoffman is there at #18, do you take him?

20 comments

Jeff Hoffman gets some terrible news; would you still draft him?  Photo via ECU Media Relations department.

Jeff Hoffman gets some terrible news; would you still draft him? Photo via ECU Media Relations department.

News came down on 5/7/14 that likely top-5 pick Jeff Hoffman, a RHP starter for East Carolina University, has a small tear in his UCL that will require Tommy John surgery (also reported here on PerfectGame and discussed on MLBTradeRumors).  Yet another high-profile starter in the sport befelled by this injury.   Keith Law believed that the Chicago Cubs (picking 4th overall) were highly likely to be drafting Hoffman … and now are re-making their draft strategy on the fly.

Here’s the question of the day: If you’re Mike Rizzo and you’re the Washington Nationals, and Hoffman drops to you picking in the first round at #18 … do you consider taking him?

Despite this injury, Hoffman likely will be drafted and will sign.  Why?  Because even if he gets the surgery tomorrow, he’s looking at least at a 12-month recovery time, which means he’d miss his entire senior season.  He could red-shirt so that he could play a 5th college season, but by the time he were to do that, he’d be pushing 23 and will have missed two full years of pro development time compared to his contemporaries.  If he signs a pro contract, he can rehab under the care of a pro baseball team that likely has had numerous other pitchers go through this surgery instead of rehabbing on his summer break from school, likely away from his college coaching and training staff.  Who may never have had to deal with an injury like this frankly.  By the time he recovers, it’ll be just in time for him to debut on a short-season squad in 2015 after having worked out since February in a team’s spring training facility.

If he’s getting any sort of decent representation, they’ll advise him to sign.

Now the question is; how far does he drop in the draft?  Mid first round?  End of the first round?  Further?  He’ll drop on everyone’s draft board; the question is just how much.  Law predicts he drops from about 4-5 to about #25 overall, citing players like Kyle Gibson and last year’s Sean Manaea as examples of players who got drafted while injured in recent years.

There is another important precident here, and it involves the Nats.  Lucas Giolito was in the discussion of going 1st overall in the 2012 draft before injuring his arm, and the Nats grabbed him at #16.  After attempting to rehab the arm all summer, Giolito’s one pro outing that year was stopped short and he had the surgery.   He returned ahead of schedule, got in 36 pro innings in 2013, and started this year in the low-A full season rotation.  One of the reasons Giolito signed was because of the Nats track record with the injury and its recovery, and its reputation for putting the player’s concerns over the teams (see Strasburg Shutdowngate and the similar handling of Jordan Zimmermann and Taylor Jordan).   Now, Hoffman is no Giolito; he’s older, his stuff reportedly isn’t quite as good, and ECU isn’t exactly in a powerhouse conference so the possibility exists that his stats are augmented.  But that’s why teams have scouts, and despite all of this he is widely considered the 2nd-best college pitching prospect in this draft (after Carlos Rodon).

I think the Nats might be tempted to grab a top 5 talent at #18, knowing that he’ll be ready to go by 2015’s short-season.  The question is whether they value that committment at #18 overall over another player.  My gut reaction is that the Nats will skip him and go a different direction, and that someone with a comp 1st round pick will grab him knowing that they have another first rounder in the bag.  But if he’s still hanging around in the mid-2nd round … I think he’d be a great roll-of-the-dice pick.

Nats Starter Matchup Analysis – April 2014

7 comments


Strasburg's K/9 is amazing so far in 2014. Photo unk via thewifehatessports.com

Strasburg’s K/9 is amazing so far in 2014. Photo unk via thewifehatessports.com

Ok people, how about getting back to talking some baseball, not arging whether or not we need to fire the manager after 28 games.  🙂

Here’s a monthly feature that I like to do, breaking down the Nats rotation performance and analyzing matchups for the previous month.


Starter “Grades” for the MLB Rotation:

Grade Taxonomy; these are just quick and dirty short hand judgements on the starting stat line for each starter’s performance.   Here’s a rough starting point  for how grades are assigned:

  • Grade A: 6-7+ innings, zero earned runs.
  • Grade B: 6-7 innings, 1-2 earned runs.
  • Grade C: 6 innings, 3 earned runs and run-of-the-mill numbers of walks/hits and strikeouts.
  • Grade D: 4-5  innings, 3-4 earned runs
  • Grade F: 4 or fewer innings, more earned runs than innings pitched.

In each letter grade case, adjustments slightly up or down are made based usually on hits+walks and/or Ks (or lack thereof).   More Ks may push the grade to an N+, a slew of extra hits/walks may drop the grade to an N-, where N is the letter grade division.

(Note: I won’t repeat this each month; it is just for explanatory purposes for the first post of the year in this series).

By way of example; the team had three “A+” outings in April:

  • Strasburg’s 4/10 win over the Marlins.  Line: 6 2/3s, 1 run on 3 hits, 1 walk and 12 Ks.   He gave up the run but 12 K’s pushed him to the A+ rating.
  • Strasburg’s 4/25 win over San Diego: 7 shut-out innings giving up 7 hits and a walk with 11 K’s.
  • Roark’s 4/26 shutout over San Diego: 9 innings, 3 hits, 1 walk, 8 K’s.

Here’s the Letter grades for our Rotation in April: (here’s a quick link to the schedule to see each individual game) along with Key Stats lines for the month:

  • Strasburg: C,D,A+,F,B+,A+.  2-2, 4.24 ERA, 1.412 whip, 2.30 fip, 53/12 K/BB ratio in 34 innings.
  • Roark: C+,D-,C,A-,A+.  2-0, 2.76 ERA, 1.163 whip, 3.43 fip, 26/9 K/BB in 32 2/3 innings.
  • Jordan: A-,D-,F,D,B-/inc: 0-3, 5.61 ERA, 1.636 whip, 4.48 fip, 17/8 in 25 2/3 innings.
  • Gonzalez: A,A,D-,A,C-,C+: 3-1, 3.25 ERA, 1.139 whip, 2.90 fip, 38/13 in 36 innings.
  • Zimmermann: A,F,A-,B,C+,A: 2-1, 3.27 ERA, 1.333 whip, 3.09 fip, 35/8 in 33 innings.

Tanner Roark turned around his slower start and has “won” the 5th starter competition, which extended a month into the season thanks to Doug Fister‘s spring training injuries.  Taylor Jordan’s letter grades bely his crummy overall stats; 0-3 with a 5.61 ERA, a 1.63 whip and a 4.49 FIP.  Lets hope Jordan can get it turned around in Syracuse and provide cover for the next injury.  Gonzalez leads the staff in ERA while Strasburg leads the staff in FIP on the back of his amazing K/9 rate (53 K’s in 34 innings for an astounding 14 K/9 rate, which leads the league right now for qualified pitchers).  Zimmerman keeps on plugging away, mixing in good outings with bad ones; lets look for more consistency from him in May.

I think its rather interesting that our three power arms are all seemingly abandoning the whole “pitch to contact” mantra so far; all of their K/9s are above a K per inning.  And Strasburg’s is just ridiculous.  Do you think maybe Strasburg is tired of his defense throwing away outs and he’s just saying, “I’ll do it myself” to some degree?  I think if I had to rank our own rotation in terms of effectiveness I’d go Gonzalez, Strasburg, Zimmerman, Roark and Jordan.  In other words, almost identically to our rotation order.

The team finishes the month 16-12, on pace for 93 wins, despite the injuries to the offense and the generally awful defense so far this year.


Now here’s some Starting Pitcher Matchup analysis.  I track of the opposing starter the team faces each night and ranked them three different ways:

  • Their Rotation Order intra team: the opening day starter for a team is their “#1” and the other four guys are ranked 2-5 as they appear in the opposing rotation.
  • Their Ranked Performance intra-team: at the time of their series with the Nats, the 5 starters on a team are ranked 1-5 on pure in-season performance.  The guy with the best season stats at that time is ranked #1, the guy with the worst #5.
  • Their Subjective League-Wide “Rank” as a pitcher: a subjective look at whether the opposing starter is a league wide “Ace,” a near-Ace or #2, and the like.

I also kept track on a night-to-night basis a quick opinion on whether I felt the Nats had the Starting Pitching Advantage (or if it was an even-matchup, or if I felt the opposing team had the pitching advantage) and tracked how we did.

Opponent Rotation Order Stats

Starter # Record Opposing Starter in Wins Opposing Starter in Losses
1 4-3 Gee, Fernandez, Weaver, Cashner Teheran (2x), Wainwright
2 4-2 Colon, Wood, Wacha, Cosart Wood, Kennedy
3 3-2 Wheeler, Alvarez, Oberholzer Harang, Lynn
4 1-3 Miller Hale, Richards, Stults
5 2-2 Koehler, Erlin Koehler, Skaggs
5+ 2-0 Hand (2x)

(Note: a “5+” pitcher means a starter who was not on the opening day roster for a team.  We’ll see a ton more 5+’s as more starters go down with injury and are replaced by minor league call-ups).

Not all #1 starters are made the same, nor are #5 starters.  The team actually holds a winning record against opposing team’s #1s and #2s (which you normally do not see), but scuffled against other team’s #4 starters.  Of course, Shelby Miller and David Hale are not ordinary #4 starters, but you’d have liked to have seen wins against the likes of Clayton Richardson and/or Eric Stults.

The team got a great win over Jose Fernandez but lost twice to Atlanta’s ace Julio Teheran.  Not the end of the world, but they need to do better (obviously) against Atlanta pitching.


Opponent intra-Rotation Ranking Stats

Starter # Record Opposing Starter in Wins Opposing Starter in Losses
1 2-4 Fernandez, Cashner Teheran (2x), Wainwright, Richards
2 2-4 Gee, Wood Wood, Harang, Koehler, Skaggs
3 4-1 Colon, Wacha, Koehler, Hand Kennedy
4 4-1 Wheeler, Oberholzer, Miller, Erlin Hale
5 3-2 Weaver, Cosart, Alvarez Lynn, Stults
5+ 1-0 Hand

In other words, the Nats are 2-4 against opposing teams’ best pitcher at the time of the series, 2-4 against the opposing team’s 2nd best performing pitcher at the time of the series, etc.   This is a slightly better way of seeing how the Nats perform against the opponent’s hottest hand at the time.  Notice here that Aaron Harang is given much higher credit for his 2014 performance than his rotation order rank may merit him.

The team (as one would expect) is struggling against the best and 2nd best guys on opponent’s teams, but are beating up on the rest of the rotation.  This is a good sign frankly; you need to win when you go against the other team’s struggling starters.  As the season goes along the team should stabilize and be able to hold its own against the best guys on other teams.


Opponent League-Wide “Rank”

Starter # Record Opposing Starter in Wins Opposing Starter in Losses
1 2-1 Fernandez, Wacha Wainwright
2 1-2 Weaver Teheran (2x)
3 5-2 Cashner, Wood, Colon, Wheeler, Miller Wood, Kennedy
4 3-2 Gee, Oberholzer, Cosart Hale, Lynn
5 2-4 Erlin, Alvarez Richards, Harang, Skaggs, Stults
5+ 3-1 Hand (2x), Koehler Koehler

In other words, the Nats are 2-1 against MLB “Aces,” 2-1 against MLB “near aces” or #2’s, etc.

This table really shows how the team has truly done against the elite pitchers in this league.  We can argue in the comments section about my subjective ranking of pitchers as being #1s, #2s, or whatever.   For comparison purposes with our own team talent-wise, I have Strasburg as a league-wide #1, Gonzalez and Zimmermann as #2s, Fister as a #3, Roark and Jordan as #5s.  Aces are few and far between; you’re far more likely to see a bunch of #4s and #5s on opposing teams.  It is of note that a 5+ starter can be a complete crapshoot; he could be a 4-A pitcher just giving the team innings or he could be the team’s #1 starter prospect and can be as effective as a #2 starter right off the bat.

So far, the team has beaten a couple of aces and had expected losses versus the likes of Adam Wainwright and Teheran.  Slightly concerning is the record against what I consider #5 pitchers in this league, though to be fair Harang and Tyler Skaggs certainly are not pitching like #5s right now.


Performace against Expectations by Advantage

By “Advantage” Record Matchups in Wins Matchups resulting in Losses
Wash 10-6 Gio-Colon, Stras-Gee, Stras-Miller, Zim-Oberholtzer, Gio-Cosart, Stras-Erlin, Gio-Alvarez, Stras-Koehler, Zimm-Hand (2x) Stras-Teheran, Zimm-Hale, Zimm-Lynn, Gio-Harang, Zimm-Stults, Stras-Koehler
Even 3-1 Gio-Weaver, Jordan-Wood, Roark-Wheeler Jordan-Skaggs
Opp 3-5 Roark-Fernandez, Roark-Cashner, Gio-Wacha Roark-Teheran, Jordan-Wood, Roark-Richards, Jordan-Kennedy, Jordan-Wainwright

In games where I thought Washington had the clear starting pitching advantage head-to-head, the team went 10-6.   I’ve listed the match ups for each case so you can decide whether we really had the advantage.

In games where I thought the pitching matchup was even, the team went 3-1; this is a good sign.  Three of these four matchups involved Roark or Jordan.

In games where I thought our opponent had the clear advantage heading into the game, the team went an expected 3-5.  Most of these matchup involved either Roark or Jordan.

It is interesting to note that Jordan struggled .. but he also had a number of very tough matchups in April.  He had to go against Alex Wood twice, Ian Kennedy, Adam Wainwright and Tyler Skaggs.   For a guy with just a handful of starts, that was a tough slate of matchups.


Per-Starter Matchup Listing:

Nats Starter Opponent Makeup Nats Record under starter
Strasburg two Aces, a #4 and three #5s 4-2
Gonzalez an Ace, three #2s, two #3s 5-1
Jordan an Ace, three #2s and a #5 1-4
Roark three Aces, a #3, a #4 3-2
Zimmermann two #3s, two #4s, two #5+s 3-3
ttl for month: 16-12

So, as discussed above, Jordan has had some tough matchups.  But Roark had to go against three staff Aces in April and still came out with a winning record.  Despite a couple of shaky outings the team was 5-1 when Gio pitched.  Lastly we can see that Jordan needs to be replaced; the team was just 1-4 in his outings and you’d have to think that they wouldn’t have a losing record when Fister throws.


April Conclusion

The Nats have beaten up on weak teams and faltered against good teams.  And it only gets tougher from here; they’ll face Philadelphia’s 1-2-3 in order in early May, then entertain Los Angeles and their two Cy Young winners.  Later on this month they visit the cavernous Oakland stadiums and go up against three different playoff calibre teams in Cincinnati, Pittsburgh and Texas.  Lots of good pitching matchups to be seen.

Pujols 500th home-run ball haul: enough?

8 comments

Too bad he probably goes into the HoF in an Angels uniform.  Photo: unknown via fantasyknuckleheads.com

Too bad he probably goes into the HoF in an Angels uniform. Photo: unknown via fantasyknuckleheads.com

As I watched soon-to-be-demoted-as-soon-as-Doug-Fister-can-return-please-hurry-back Taylor Jordan give up the second moon-ball home run to Albert Pujols on the night, I thought to myself, “wow, I wonder what i’d hold out for if I caught his 500th home run?”

Here’s the answer, thanks to Scott Allen and the DC Sports Bog on WP.  The guy who caught the ball is giving it back to Pujols for … nothing.

Now that I have a kid, I’m sure i’d want some cool stuff for his memory books.  I’d at least want a custom-message signed ball (that’s my goal one-day, to head up to cooperstown with a bunch of 50s and 100s in my pocket and hit the circuit of Hall-of-Famers on the signature series for custom-signed baseballs).   In total, I’d probably settle for some signed jerseys and baseballs and what not.  I mean, hey, that ball may have been worth thousands on the auction market, but its better karma to just return it to the hitter, right?

Oh, and since this is a Nationals blog, supposedly focused on pitching, all I have to say about this team can be summed up in some bullet-points for now:

  • 6.23: that’s Jordan’s current ERA.  And unlike Strasburg‘s “unlucky” high ERA (Stras’ FIP is a miniscule 2.58, the best on the team, proof of why you should probably ignore both ERA and ERA+), Jordan’s clearly not an effective starter right now.  I think the 5th starter competition is over, especially after Tanner Roark‘s excellent outing the night before … which was completely wasted by…
  • Tyler Clippard, who may not have bad numbers so far but boy he has struggled.  You just can’t have a 1.5 whip as an 8th inning/high leverage guy.  Maybe its time to switch him and Drew Storen in the bullpen pecking order (you know, since so far he looks basically unhittable, giving up just 2 baserunners in 7 1/3 innings).
  • 8-1: that’s the Nats record against crummy teams.
  • 3-9; that’s the Nats record against “good” teams so far.  I sense a pattern.

I’m kind of concerned right now.  It doesn’t really help that the teams’ #2 and #4 hitters from opening-day are on the D/L.  But it also doesn’t help that, once again, Mike Rizzo‘s vaunted “lead-off” hitter Denard Span is barely batting above the frigging mendoza line yet continues to be plugged in at lead-off, where he can maximize the damage he does to run expectancy as he scuffles along with his sub .300 OBP.  How long before Matt Williams just sticks him at the #8 spot where he should have been most of last year and starts using hitters at lead-off who can, you know, hit?


Nationals 2014 Walk-on music review Part 2: Pitchers

leave a comment

Part 1 was the Hitters.  Here’s the pitchers.

Note: I’m going solely on the research of others here; I’ve only been to one game so I cannot personally confirm the walk-up music of all these players.  Here’s the team official list of each player’s 2014 walk-up music, and here’s Cheryl Nichols/DistrictSportsPage’s research on this year’s walk-up songs.

Relievers have historically had some memorable walk-up songs; Trevor Hoffman and Mariano Rivera both came to be known for their music and the songs became anthems for the players even before they emerged from the bullpens.  Somehow I don’t think any of our current relievers are headed that way; our closer has a rather “unique” song (story below) and isn’t nearly as dominant as these two hall-of-fame bound guys.

Here we go.  As with part 1, my non-scientific/tongue-in-cheek opinion of each guy’s song is listed.

Starters

  • Stephen Strasburg – Seven Nation Army by The White Stripes.  Great choice; this song was the unofficial anthem of a recent European Championships soccer tournament and its somewhat chilling to hear an entire crowd hum the intro notes.  Lets hope this happens with Stras.  Grade: A
  • Gio Gonzalez: unknown?  Nichols only has his batting music (Trophies by Young Money & Drake).  Last year he was  House Party (feat. Young Chris) by Meek Mill, which I’m ambivalent over.  Grade: Inc
  • Jordan Zimmermann – Hell On Wheels by Brantley Gilbert.  Country, blech.  Plus how am I inspired to cheer after hearing this song?  Grade: C
  • Taylor Jordan – Collide by Skillet.  Good sound, kind of like a newer Linkin Park.   But, not very obvious to the masses.  Grade: C+
  • Tanner Roark – Kickstart My Heart by Motley Crue.  Like it; old school, not an obvious Crue selection either.  Grade: A-

Relievers

  • Rafael Soriano – El Rey de Monticulo —”The King of the Mound” by Ediseuri Concepcion Mejia (Story behind song).  Nichols links to a WSJ article explaining this song, which has custom lyrics just for Soriano.  Understandable why he uses it.   Grade: B
  • Tyler Clippard – Ready or Not by The Fugees.  Eh.  Sorry, he’ll never beat  “Peaches” by the Presidents of the United States of America.  Never should have gone away from it.  Grade: D
  • Drew Storen When the Lights Go Out by The Black Keys.  This as opposed to what the official team site believes he’s playing for himself (“Bad Company” by Five Finger Death Punch).  I’m not as big of a fan of the Black Keys song, but I like the Bad Company remake by FFDP.  Grade: C
  • Craig Stammen – Eye of the Tiger by Survivor.  Classic sports anthem, how can you beat it?  Grade: A
  • Aaron Barrett – This Is What It Feels Like (W&w Radio Edit) by Armin van Buuren Feat. Trevor Guthrie.  Wow, never thought I’d see a major leaguer going deep into techno/trance and pulling AVB out.  Excellent.  Grade: A
  • Jerry Blevins – Sympathy for the Devil by The Rolling Stones.  Another great, classic song, appealing to the older crowd.  Grade: A-
  • Ross Detwiler – Wherever I May Roam by Metallica.   My kind of music; he had to stay away from songs from the same artist made more popular by other guys.  This is kind of a unique Metallica offering, a deeper cut but still has recognition.  Grade: B+
  • Blake Treinen – unknown; he hasn’t returned home yet.  Can’t wait to see this guy throw .. and hear what song he’s listening to.  Grade: Inc

I seem to be a bigger fan of the pitcher’s walk-up music than our hitters.  Biased?  Probably.

I’m inspired by the AVB choice from Barrett.  If I was doing a song right now i’d probably pull from the same genre.  Check out:

  • Ready, Steady, Go from Paul Oakenfold; try not to be thrown off by the incredibly weird video; this song was used in one of the Bourne movies (played during a car chanse scene) and the beginning of the song would be perfect for a walk-out.
  • Where’s your Head At from Basement Jaxx: you may have heard this before; it did get some play domestically.  Basement Jaxx is a UK-based band that almost never comes to the states: my brother and I once flew to London for a weekend to see them play at Wembley arena.  Ah, the days of being single 🙂
  • Superstylin from Groove Armada; a band you’ve probably never heard of but they rock.  Saw them at 9:30 club a decade ago and I don’t think they’ve been back to the states since.  You’ll recognize another of their hits, “I See You Baby,” a remix done by Fat Boy Slim that was sampled by the inveterate show MTV Cribs for years and years.  I could pull this song off too.
  • Lastly, perhaps i’d figure out something to play from DC-based Thievery Corporation to get the home-town angle, but their stuff is mostly so down-tempo that it’d be hard to find a sample that made sense for walk-up music.   Click here for an example; “Lebanese Blonde from their 2000 album The Mirror Conspiracy.

Ok, that was a serious tangent from baseball.  🙂  Maybe i’m trying not to think about some looming storm clouds for the team right now.  You know, a 5.00 ERA for our starters, a ton of injuries, the most errors in the league, getting our hats handed to us by Atlanta so far … and the Cards and their rotation coming into town for a potential 4-game beat-down unless our guys can figure out how to keep runners off-base.  Last night’s win over Jose Fernandez and his sick stuff was a great help though; if they can get to Fernandez for 3 runs, they should be able to hang with St. Louis’ hurlers.  Lets see.


Yordano Ventura: MLB’s newest velocity revalation

8 comments

Ventura has some serious heat.  Poto Mandatory Credit: Brad Penner-USA TODAY Sports

Ventura has some serious heat. Poto Mandatory Credit: Brad Penner-USA TODAY Sports

I present to you without further ado Kansas City’s Yordano Ventura‘s Pitch F/X stats from last night’s MLB debut start.

According to Pitch F/X, he threw 45 fastballs on the night with an AVERAGE velocity of 99.5mph, peaking at an absurd 102.9mph on one of the final pitches he threw as he finished off 6 shutout innings against the Rays.  He’s 5’11” and 180 soaking wet.

Lest you think he only has one pitch, he has a sick 89mph change with circle action (i.e., coming back in against righties); he threw 19 of them last night and 13 of those 19 change ups were “SNIPs,” or “Strikes not in play.”  In other words … exactly what a pitcher wants.   He only gave up one ball-in-play on his changeup the entire night.  He also featured a curve that has somewhere in the 16mph range difference from his fastballs (by way of comparison, everyone raves about guys like Strasburg and Kershaw‘s fb-curve deltas, as I talked about in this post from last year, and Ventura is right up there).   He threw a 4th pitch (a cutter in the 96-98mph range) but its awfully hard to tell if it had much action on it, or which pitches Pitch F/X thought were cutters versus just him taking a couple MPH off his fastball.

Fun to watch, absolutely.  Lets hope he’s not a TJ-surgery in waiting.

Written by Todd Boss

April 9th, 2014 at 9:17 am

Nats Trivia: Home Opener and Record Attendance Figures 2014 Edition

leave a comment

Here’s some useless trivia related to the Nats home openers, now that we have the Nats 10th home opener in the books.

Nats Trivia: capacity of Nats park? 

  • 41,888 at opening
  • 41,546 in 2010
  • 41,506 in 2011
  • 41,487 in 2012
  • 41,418 in 2013
  • 41,506 for 2014

Interesting how the capacity has slightly decreased each year but jumped for this year.  Do we know where they’re adding/removing seats?   By the way, RFK capacity: 45,596 per wikipedia/ballparks.com.

Nats All-time Record attendance?

  • 45,966 10/12/12 game 5 2012 NLDS

Other/Previous Attendance Records

  • 45,274 Opening Day 2013 (new and current Regular Season record for Nats park)
  • 45,017 10/10/12 first home playoff game
  • 44,685 8/20/11 vs Phillies (longer standing Nats park record)
  • 41,985 6/24/09 vs Boston. (Nats reg-season record standard bearer for a while in the new stadium)
  • 45,157 Fathers day 2006 vs Yankees (long standing Regular season Record)
  • 45,596 RFK franchise opener (long standing franchise attendance record)

Opening Day Attendances and weather through the years

  • 2014: 42,834 (1:05 Friday game, 50s and overcast)
  • 2013: 45,274 (1:05 Monday game, 60 and beautiful)
  • 2012: 40,907 (1:05 Thursday game 56, partly cloudy)
  • 2011: 39,055 (1:05 Thursday game, 41 degrees and overcast)
  • 2010: 41,290 (1pm game Monday, beautiful weather 80s and sunny): this was the “Phillies invasion” game.
  • 2009: 40,386 (3pm game on a Monday, chilly 53degr and overcast).
  • 2008: 39,389 (season and stadium opener), 8pm Sunday night, nat’l tv, clear but very cold.
  • 2007: 40,389 (in rfk, 1pm game vs Florida, 72degrees)
  • 2006: 40,516 (in rfk, Tuesday day game vs Mets, 72degr and sunny)
  • 2005: 45,596 (in rfk, debut of entire franchise, 62degr and clear, evening game)

Opening Day Box Scores and Results

Nats are 4-6 in their home openers now since moving to Washington, and they’re just 2-6 in non-stadium openers.  Just one starter has thrown more than one home opener for the Nats: Livan Hernandez.  When Livan gets elected to Cooperstown, I hope he’s wearing the curly W.  🙂

  • 2014: mlb.com or b-r.com.  Braves d Nats 2-1.  WP: Luis Avilan.  LP: Tyler Clippard.  (Starters: Jordan Zimmermann and David Hale).
  • 2013: mlb.com or b-r.com.  Nats d Marlins 2-0.  WP: Stephen Strasburg.  LP: Ricky Nolasco
  • 2012: mlb.com.  Nats d Reds 3-2.  WP: Craig Stammen. LP: Alfredo Simon (Starters: Gio Gonzalez and Mat Latos)
  • 2011: mlb.com.  Braves d Nats 2-0.  WP: Derek Lowe.  LP: Livan Hernandez
  • 2010: mlb.com.  Phillies d Nats 11-1.  WP: Roy Halladay.  LP: John Lannan
  • 2009: mlb.com.  Phillies d Nats 9-8.  WP: Jamie Moyer.  LP: Saul Rivera (Nats Starter: Daniel Cabrera)
  • 2008: mlb.com.  Nats d Braves 3-2.  WP: Jon Rauch.  LP: Peter Moylan (Starters: Tim Hudson and Odalis Perez)
  • 2007: mlb.com.  Marlins d Nats 9-2.  WP: Dontrelle Willis.  LP: John Patterson
  • 2006: mlb.com.  Mets d Nats 7-1.  WP: Brian Bannister.  LP: Ramon Ortiz
  • 2005: mlb.com.  Nats beat Arizona 5-3. WP: Livan Hernandez. LP: Javier Vazquez

Opening Day Starter Trivia – Updated for 2014

one comment

CC Sabathia continues to be the active leader in Opening Day starts. Photo via wiki/flickr.

Some of my favorite trivia questions  revolves around Opening Day Starters.  With another Opening Day in the books, here’s some useless trivia related to Opening Day starters.  I’ve updated my Opening Day Starters spreadsheet to Google Docs and created a link in the “Nationals Arm Race creation” section along the right.  Fyi, on a team-by-team basis you can query Baseball-Reference.com for the opening day lineups (here’s the Washington/Montreal franchise’ opening day lineup history as an example).

Current Active Leaders in Opening Day Starts

11 CC Sabathia
9 Mark Buehrle
7 Felix Hernandez
7 Justin Verlander
6 Bartolo Colon
6 Tim Hudson
6 Jered Weaver
6 James Shields
5 Josh Beckett
5 Yovanni Gallardo
4 Jake Peavy
4 Tim Lincecum
4 Clayton Kershaw
4 Jon Lester
3 Strasburg, Cueto, Wainwright, Price, Masterson, Nolasco
2 Lee, Samardzija, Liriano, Dickey, Sale, Feldman

Those players bolded in the list above had 2014 opening day starts and added to their totals.   (Note; there’s plenty of guys out there with 2 or 3 opening day starts but who did not extend their count in 2014; they are not included here).  With the retirement of Roy HalladayCC Sabathia extends his active lead in this category.  Mark Buehrle has given over the reigns of opening day starter possibly for good, based on his standing in the Toronto rotation.  Meanwhile the next closest competitors (Justin Vernalder and Felix Hernandez) could eventually supplant Sabathia, especially if he continues to struggle and gets replaced as the Yankees’ ace.

Felix Hernandez and Justin Verlander continue to be the best bets to broach the all-time records (see below) based on their ages, their current counts and their new long-term contracts.

Answers to other Opening Day start trivia:

Current Active Leader in consecutive Opening Day Starts: Sabathia with 9 consecutive, split among two teams.  Second is Verlander with 7 straight, albeit all with the same team.  There was talk about how his Cy Young-winning rotation mate Max Scherzer should have gotten the ball this year, given Verlander’s 2013 struggles.

Most ever Opening Day Starts all-timeTom Seaver with 16 in his career.

Most ever Consecutive Opening Day Starts: Hall of Fame lightning rod Jack Morris, who made 14 straight such starts.

Number of first-time opening day starters in 2014: Ten (10) guys got the ball on opening day for the first time, slightly down from last year’s 13.  Injuries gave some pitchers the ball on opening day over other expected rotation mates (this is definitely the case with the likes of Julio Teheran, Tanner ScheppersSonny Gray, Dillon Gee, Jorge De La Rosa), and its probably the case that others got the ball on opening day thanks to their own personal ascention to the “lead-dog” spot on their teams (Jose Fernandez, Madison Bumgarner).  The other three newbies (Andrew CashnerWade Miley, and Chris Tillman) probably fall somewhere inbetween these categories.

Who seems most likely to break Seaver or Morris’ Records at this point? Still Sabathia, who already has 11 opening day starts (and 9 straight), is the #1 in New York, is only 32 and still has four years on his current deal. However, he took a big step backwards in 2013 performance-wise, and the Yankees spent a ton of money on Masahiro Tanaka, and there could be a passing of the torch if Tanaka blows it out in 2014.  Meanwhile Hernandez already has 7 opening day starts, just signed a deal that takes him through 2019 with a relatively easy option for 2020.   That’s many more seasons under contract and he’d only be 34 years of age by its end.   He could be the standard holder if he stays healthy and continues to pitch like an ace.

Most Inconsisent team using Opening Day Pitchers: Oakland.  They’ve used 9 different opening day starters in the last 9 seasons, and that’s likely to continue since both the candidates for this year had injuries that forced them to go to a rookie for 2014.  Pittsburgh is right behind them;  they have used 7 different opening day starters in the last 7 seasons, and 13 different starters in the last 15 seasons. The Nats have at some point employed no less than three former Pittsburgh opening day starters: Ron Villone, Oliver Perez and Zach Duke.   Colorado, Baltimore and Minnesota have also struggled for most of the past decade to find a dominant, reliable “Ace” and constantly cycle through new opening day starters, and once again each is using a different guy in 2014.


DC-IBWA pre-season predictions for Nats 2014 individual leaders

4 comments

Happy Opening day!

Every season David Nichols (editor in chief of DC Pro Sports Blog) organizes the unofficial DC Chapter of Nats bloggers to do some surveying about will happen, and then a post-mortem about what happened.

For 2014; here’s how the DCIBWA members voted in total.

And here’s how I voted:

1. Who will lead the Nats in home runs in 2014?  Hard not to go with the kid Bryce Harper.  I’ll predict he manages to stay healthy, stop running into walls, and hits 32 bombs out of mostly the middle of the order.  Last year’s leader was Ryan Zimmerman, who I like for 20-25 homers again but not as many as Harper.

2. Who will lead the Nats in RBI?  I’m going with Ryan Zimmerman here, mostly because I feel like he’s going to be the beneficiary of many guys getting on base ahead of him and will have plenty of RBI opportunities.  Last year’s leader was Jayson Werth by a hair; something tells me he’s more of a table-setter this year (a #2 hitter) rather than a middle of the order bat.  I could be wrong though.  (Insert obligatory argument about lineup construction and dazzle us with your proof of why your best hitter should be batting 2nd while the 3rd place hitter should be one of your lesser batters…)

3. Who will lead the Nats in stolen bases?  I’ll go with 2013 leader Ian Desmond again; Denard Span is the obvious choice here but he seems to have lost a step.  All in all, speed on this team seems to be lacking on this team; will Matt Williams be a more- or less-aggressive manager on the basepaths?

4. Who will lead the staff in wins?  Stephen Strasburg, who I feel is destined for a break-out season with no leashes and no afterthoughts of his injury.  He’s two years removed from TJ recovery; when 2013 staff wins leader Jordan Zimmermann was in his 3rd year back he went 19-9 and got Cy Young votes.  I predict a 20 win season for Mr. Strasburg, some serious consideration for a Cy Young, and a significant arbitration fight next off-season.

5. How many games will Ryan Zimmerman play first base?  I’ll go with 10-12, maybe fewer.  Perhaps once a week he’ll go over to the other corner.  Something tells me that Adam LaRoche in a contract season will step it up and make it really tough to take his bat out of the lineup.  And something else tells me that Zimmerman may return to his plus-defense now that his shoulder issues are seemingly behind him, and we’ll be talking about how we can stick with him at 3rd for the long haul when the season is over.  (I may be eating my words on Zimmerman here; he’s already shown some air-mailing tendencies during Spring; such a shame that his arm is affecting his overall defense so badly).  For what its worth, Zimmerman has played a grand total of 2 innings at first this spring.

6. Who starts more games: Ross Detwiler, Taylor Jordan, Tanner Roark, Ross Ohlendorf?  Tanner Roark.  The winner of the 5th starter spot will pitch to a relatively non-descript league average for months, while the loser (Taylor Jordan) toils in obscurity in Syracuse, waiting for Roark to fail or someone to get hurt.  Ross Ohlendorf‘s trip to the 60-day D/L means he’s likely a non-factor for the first half, and Ross Detwiler‘s trip to the bullpen looks permanent.  (When I wrote the first draft of this in Mid Feb, it was Detwiler).  Even given what has transpired at the end of spring (Fister’s D/L trip meaning both guys are in the rotation), I feel like Roark is going to stick when Fister comes back.

7. Who will get more at bats for the Nats this season: Danny Espinosa or Jamey Carroll?  Danny Espinosa obviously, since Carroll has already been released.  But even in my first draft of this post in Feb, I was predicting that Espinosa would win the backup middle infielder battle with Jamey Carroll.  I just didn’t think the team was ready to punt on a former 20-home run guy with superior defense.

8.  Which minor leaguer are you most interested in keeping tabs on this season?  Instead of copping out and saying an obvious name from our consensus top 3 prospects (Giolito, Cole and Goodwin), I’m going to throw out a couple other names that really intrigue me.  Matt Skole lost all of 2013 by virtue of a freak injury but impressed last year; i’d like to see him bash his way into consideration for a call-up.  I’d like to see what 2013 draftee Austin Voth can do in a full season; I like this guy as a sleeper, a potential Tim Hudson-esque mid-rotation starter who doesn’t get a ton of credit because of his size but suddenly is posting double-digit wins for your team.  I’d like to see what Matthew Purke does this year; the shine is off this guy; I’d really like to see him put himself back into relevance with this organization.  Like everyone else Stephen Souza has really elevated his status; what can he bring to the table if he gets an opportunity?  And lastly we now know that fireballer Blake Treinen is in the AAA rotation; is he a behind-the-scenes important piece of rotation depth for this farm system now?

9.  Who will reach majors first: Sammy Solis, A.J. Cole, Lucas Giolito or Matt Purke?   Well, this one is easy to me; Sammy Solis is on the 40-man, is 25, and is already being talked about as being a potential loogy in 2014.  After that I’d predict Purke (also by virtue of  his 40-man placement); if Purke shows the team something or anything this year, he could earn a Sept 1 call-up to help in the pennant race.  After that say Cole since he will be put on the 40-man this coming off-season (if not before) and then Giolito last; he’s not rule-5 eligible til 2016 and would have to pitch his way into relevance before then (much like Taylor Jordan did in 2013).

10. How many all-stars will the Nats have? Who?  I’ll predict three: Strasburg, Desmond and Harper.

11. Total wins and what place in the division?  94 wins, 1st place in division.  This could trend higher with every new Atlanta injury.

Essay: What should be the single most important development for the Nats this season?

Hitting in the clutch.  The 2013 team to score 80 fewer runs than the magical 2012 team despite a lineup that seemed better on paper.  A lot of this regression was due to the drop-off in bench production, but an awful lot of it was due to coming up weak in the clutch.  In high-leverage batting situations (as defined by fangraphs), the Nats were dead last in 2013.  This team needs to do better all the way up and down the lineup.  We need Harper healthy.  We need Span producing like he did in September.  I’d like to see something better out of LaRoche in 2014.  Give us that and all these great pitchers will look that much better.


My 2014 Fantasy Baseball Team

2 comments

Adam Jones; my #1 fantasy draft pick in 2014.  Photo unk.

Adam Jones; my #1 fantasy draft pick in 2014. Photo unk.

As with years past … feel free to skip this post if you don’t care about fantasy.  I know for certain that reading about someone elses’s fantasy sports team can be a bit grating.  But, if you do play fantasy i’m sure you’ll at least appreciate reading the selections and then looking at the team’s strength analysis at the end.

I’ll include a jump line so your RSS feeds aren’t blown out either.

Read the rest of this entry »