Nationals Arm Race

"… the reason you win or lose is darn near always the same – pitching.” — Earl Weaver

Archive for the ‘roger clemens’ tag

How will HoFame balloting be affected by the voter purge?

7 comments

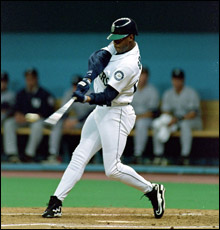
Griffey is a shoe-in for 2016 class; who else might be affected? Photo via freeteam.com

Griffey is a shoe-in for 2016 class; who else might be affected? Photo via freeteam.com

(Editor note: we’ll take a quick break from the minor league reviews and arguing about why the Nats are trying to fill a 5th starter spot instead of one of their several obvious needs for that classic Late December task: arguing about the Hall of Fame.  I wrote most of this post much earlier this summer/fall, waiting for the “hall of fame” blogger season to post it.  Now’s as good of a time as any).

In the middle of the 2015 post-season, an interesting tidbit got reported by NBCSports’ Craig Calcaterra: The Hall of Fame BBWAA electorate has been reduced by a whopping 20% thanks to the new voter eligibility rules announced back in July 2015.

20% of voters!  That’s a huge number.  I thought the rules, when they were first announced, would have a negligible effect on things and would be a paper tiger.  But losing 20% of the voters will have a profound effect on the ballots going forward.  I agree with Calcaterra in characterizing these types of voters as generally being out of touch, industry-has-passed-them-by, believe everything they read from Murray Chass types who have directly led to the ballot congestion and the ridiculous voting patterns we’ve seen lately.  No word yet on whether the category of writers purged also includes those who no longer cover the sport actively (the most egregious example being the 3 voters who write for www.golferswest.com) who not only kept their votes but felt the need to pontificate about the state of the sport!).

Early returns are promising, by the way.  The BBHOF tracker website has taken the lead in collecting all published ballots and they’re tracked directly in this Google xls.  As of the time of this writing, they have about 20% of the ballots in the tracker spreadsheet and borderline candidates like Piazza, Raines and Bagwell are all trending above the 75% needed.  Griffey is at a perfect 100% and still looks like a good bet to beat Tom Seaver‘s all time record.  That is until some curmudgeons decide they like Seaver more than Griffey and send in blank ballots or some dumb-ass thing.

Key Dates in 2016 HoF class voting:

  • 11/9/15: ballot officially released, though we’ve known for years who’s actually on it thanks to baseball-reference.com.
  • 12/21/15: BBWAA ballots due back to Cooperstown for counting
  • 1/6/16: Class of 2016 announced, as well as 10,000 internet blogger posts on the topic.
  • 7/24/16: Official induction ceremony for the Class of 2016 in Cooperstown, NY

Anyway.  Lets look at the 2016 Ballot (hey, its never too early to do Hall of Fame vote analysis) and guess how things may go for the candidates, now that 20% of dead-weight is gone.

  • Ken Griffey Jr: if anything, his chances of breaking Tom Seaver‘s vote % record may rise thanks to the elimination of a bunch of curmudgeons who have been witholding votes inexplicably to prevent there ever being a unanimous inductee.  Easily gets elected in 2016.
  • Trevor Hoffman: might be hurt by more new-age voters who realize how minimal the impact of a closer is, no matter how good (Hoffman had just a 28.4 career bWAR, less than Mike Trout had accumulated by the end of his third full season, by way of comparison).

There’s not really anyone else new to the 2016 class worth mentioning; I could see Jim Edmonds getting 5% of the vote to stay on the ballot but nobody else getting much more than home-town beat writer sympathy votes.  This isn’t an indictment of Edmonds at all; there’s just too many good players on the ballot (our lament every year) and I think he’s a worthy candidate (some of the Jay Jaffe JAWS analysis on Edmonds is pretty telling; for a period of 10 years during his peak he trailed only Griffey and Bonds in terms of WAR).

How about the hold overs?  I think there’s good news for some guys:

  • Mike Piazza/Jeff Bagwell: two “PED-suspicion” guys who have never had any actual concrete proof against them probably now get in thanks to the elimination of a class of voters who probably believed everything they read in the anonymous-sourced NYTimes articles from 10 years ago.  Bagwell has further to go and may not get to 75%, but Piazza should.
  • Tim Raines: the more older/non sabremetric appreciating voters that go mean the higher percentage of votes Raines will get from more modern voters who realize just how valuable he was.  Like Bagwell, he has further to go and may not get to 75% this time, but between 2016 and 2017 he should get in.
  • Roger Clemens/Barry Bonds: I can see their vote totals rise from the 35% they’ve  been getting into the 50% range, still not enough to get enshrinement.  Still too many wounds and not enough voters who can overcome their disdain for what happened.
  • Mark McGwire/Sammy Sosa: same story as Clemens/Bonds, except whack off another 20% of votes.
  • Curt Schilling/Mike Mussina: Hard to see their vote totals changing much; older voters were probably giving Schilling too much credit for the bloody sock game but new voters havn’t supported him as much as expected (and he’s doing himself no favors with his continued idiotic political twitter posts).  Mussina just doens’t seem like the kind of pitcher that gets elected to the Hall thanks to a long career without specific accolades and being a known pr*ck to the media.

Everyone else held over from the 2015 ballot not already mentioned (Smith, Martinez, Trammell, Kent, McGriff, Walker, Sheffield, Garciaparra) each have specific issues that likely prevent any of them from getting much above the vote totals they’ve already gotten and probably won’t be helped much by the purge of the electorate.  I would vote for some of these guys (namely Martinez and Trammell) but understand why others don’t.

This is as close to a prediction piece as we’ll do for the Hall of Fame 2016 ballot (there’s way too many of them already), but my guess is that we’ll be seeing just Griffey and Piazza in Cooperstown in July 2016, with Bagwell, Raines and perhaps Hoffman right on the cusp to join them in 2017 (where the incoming class has some pretty serious PED-related issues that should be fascinating to watch play out; more on that in a year’s time).

Here’s some similar articles for your Hall of Fame perusal:

Ask Boswell 3/23/15 Edition

14 comments

Scherzer is your 2015 opening day starter.  Photo via Scherzer's twitter account.

Scherzer is your 2015 opening day starter. Photo via Scherzer’s twitter account.

So, I’ve been quiet on the blog front lately.  Not much to write about right now, other than the injury bug that seems to be going around camp.  Max Scherzer named the opening day starter; I guess that’s news for a Monday.

Lets peek at today’s Tom Boswell 3/23/15 chat to see what kind of questions he fielded.  Despite it being post-March Madness, there’s still some baseball talk going on.  As always, I answer here before reading Boswell’s answer and edit questions for clarity.

Q: Say the Nats are under .500 after a couple of weeks. Will a full-scale panic start, or are team and fans’ nerves stronger than that?

A: Maybe the media’s panic will set in, but probably not the fans.  If the team is sub .500 after two months … you’d have to start asking some questions.  Same kind of questions we asked basically all of 2013.  Of course, that being said, the Nats’ early-season calendar isn’t exactly challenging:  10 of their first 11 series of the year are against teams that were sub .500 last year.  Now, we are expecting some of these teams (especially Boston, San Diego, Miami) to be much improved from last year … but the point remains.  The team has no excuse to not come out of the gates firing.  Boswell notes that if all the current injured Nats remain hurt on 4/1 … that fans will expect a long April.  He then goes on a long tangent about how screwed up the Dodgers are right now.

Q: Notwithstanding Taylor’s excellent weekend; I don’t understand why Williams would bat him lead-off (regardless of Taylor’s leadoff “skills”) but wouldn’t bat Harper higher than sixth.  Does Williams have a double standard for prospects not named Harper?

A: A good question.  Certainly some people have questioned Matt Williams‘ ongoing public criticisms of Bryce Harper.  Why call him out, in the media, for his supposed transgression of baiting the runner into trying for second?  Dude; its the 2nd week of March; it isn’t a big deal.  Except by calling him out in public, it *becomes* a big deal since Harper is such a lightening rod in the National media (deserved or not).  My two cents: there’s no lack of evidence coming out of the Arizona Diamondbacks organization over the last few  years about the institutional bull-headedness concerning “the right way to play” and other old-school baseball idioms, and it seems to me that Williams has continued his dogged old-school ways as the on-field leader of the Nats.  Is this a good thing?  Probably not.  Harper is talented enough to back up his actions (see last year’s NLCS when Harper was one of only two Nats hitters to bother making the trip to SF).  But will this conflict become a distraction?  Will it drive Harper from this team eventually?

Sorry for that tangent.  To answer the question at hand; with Denard Span out, *someone* has to bat lead off, and if you’re an “old school” guy who do you pick?  Do you pick the skinny, fast center fielder?  Or do you take a smarter look at your hitter capabilities?  I guess we’ll see.  Boswell says that Taylor batted leadoff in the minors, so he’s ok there.  Uh; the bush leagues playing infront of a few hundred people isn’t quite the majors.  Oh, and Boswell conveniently “explains” why Harper was batting 6th too.  Williams, the old-school manager for the old-school baseball writer Boswell.

Q: Why is Pete Rose back in the news with regard to reinstatement?

A: Because new commissioner Rob Manfred was dumb enough to engage Pete Rose‘s request?   The Dowd report was a pretty galling chronicle of Rose’s activities.  I think Rose appears as a sympathetic figure because of the ardor to which former commissioner Bart Giamatti pursued his penalty.  I too was sympathetic to Rose, feeling like baseball went far out of its way to rid themselves of him at the time.

But, now with time and retrospection, Rose’s sins were pretty bad.

I think the best way for baseball to deal with the likes of Rose, Shoeless Joe Jackson, Barry Bonds, Mark McGwire, Roger Clemens and perhaps others will to eventually create a special election with large caveats to their enshrinement.  Yes these players were among the best in the game … but broke cardinal sins against the game.  Imagine a veteran’s committee designed to create a permanent special exhibit in Cooperstown dedicated to great players who have clouds surrounding their names.  I dunno.  The cynical part of me says that the museum based in upstate New York has no incentive to *ever* stop the rhetoric surrounding these guys.  It gets tiresome to argue about the *same things* over and over … but we do it anyway, year after year.

Boswell coincidentally advocates for Rose for the HoF but not an active role in the game. 

Q: With the Nats celebrating ten years in the District, do you have any random memories that stand out since they’ve been in town?

A: I put out a post periodically that talks about “Best games” in Nats history.  This question kind of feels like the games captured in this post and in the comments.   No need to re-answer.

Q: Who deserves the opening day start?

A: You can make a pretty cogent argument for any of the three of Strasburg, Scherzer or Zimmermann.  Strasburg since he’s gotten three straight such starts and normally you don’t replace the home-grown “Ace” of a team.  That’d be my choice and my argument, coincidentally.  Zimmermann b/c of his no-hitter last year and generally accepted stance as the “actual” best hurler on the team.  But its now known that Scherzer is getting the nod (not a real big surprise once you saw how the rotation was laid out starting from early spring).  For me (as noted in the prior thread’s comments), Scherzer is the only guy with a Cy Young to his name, so it isn’t surprising that players’ manager Williams goes with the veteran with the most career accomplishment in that ceremonial spot.  Works for me; we just bought our opening day tickets (we’re in section 131 I think) so I look forward to seeing him pitch.  Boswell says that Strasburg’s sore ankle cost him the spot.  BS. 

Q: With the likelihood of multiple starters starting the season on the DL, how do you see that effecting the bench players on the roster.

A: We’ve talked about this before, but clearly it means that at least one, perhaps two NRIs are getting opening day jobs.  And it means that some options-limited guys are getting shots too.  If Span is out a month, Werth can’t make opening day, if Rendon is down and out, if Escobar can’t get enough reps … that’s a lot of spots to fill.  For me, just guessing, i’d say the team heads north with Tyler Moore, Tony Gwynn Jr, Michael Taylor and maybe Ian Stewart to start the season.  Dan Uggla?  Numbers are good; lots of walks.  But he can’t play 3B (not well, presumably) and its 3B where the team might need some cover.  Boswell is more bullish on Uggla, thinking he’d be a huge steal.  I dunno; can’t play SS, doesn’t bat lefty. 

Q: Are there going to be any longer-term impacts to demoting Tanner Roark to the bullpen?

A: Maybe.  Is it a coincidence that Roark has the worst starter stats of any pitcher this spring?  Probably not; spring training NRIs have a tendency to be uber aggressive, and minor league defenders aren’t always adept at catching the ball when playing out of position.  Maybe not; Roark’s attitude has sounded great, and he’s hopefully being told that he’s first in line and likely will get a big number of starts filling in for the inevitable injuries.  He’ll have his rotation spot back next year for sure.   Boswell doesn’t think so.

Q: If the Nats don’t make it out of the first round of the playoffs this year (assuming they will make it), do you think the fans develop the same anxiety that Caps fans have over the years?

A: Yes.  Two playoff appearances, two “best record in the majors” and two impotent first round exits to wild cards.  If the Nats fail in 2015, then  yeah we may begin to wonder what’s going on.  Boswell points out that the Caps have one of the worst track records in professional sports.

Q: What is your opening day lineup (including who leads off) given the injury spate?

A: If it were me?  If we assume that everyone who is  hurt is *not* making it to opening day, I’ll go with something like this:

Escobar-Desmond-Harper-Zimmerman-Ramos-Moore-Frandsen-Taylor pitcher.  Escobar at 2B, Moore in LF, Frandsen at 3B and Taylor in CF.  Not a great lineup.

A better assumption is that Rendon and Werth will make opening day, which makes the lineup a lot easier.  Escobar-Rendon-Harper-Zimmerman-Werth-Desmond-Ramos-Taylor-pitcher.  When Span returns, put Escobar at #8 and that’s that.

Boswell doesn’t give a leadoff-suggestion, but using induction by reduction, he’s likely pushing for Escobar at lead-off too.

Q: Is it time to cut the cord on Espinosa?

A: Not until you find someone else who can play short stop in a pinch who isn’t already slated to start.  Boswell gives a non-answer too.  I don’t feel bad.


2015 obligatory Hall of Fame Post

6 comments

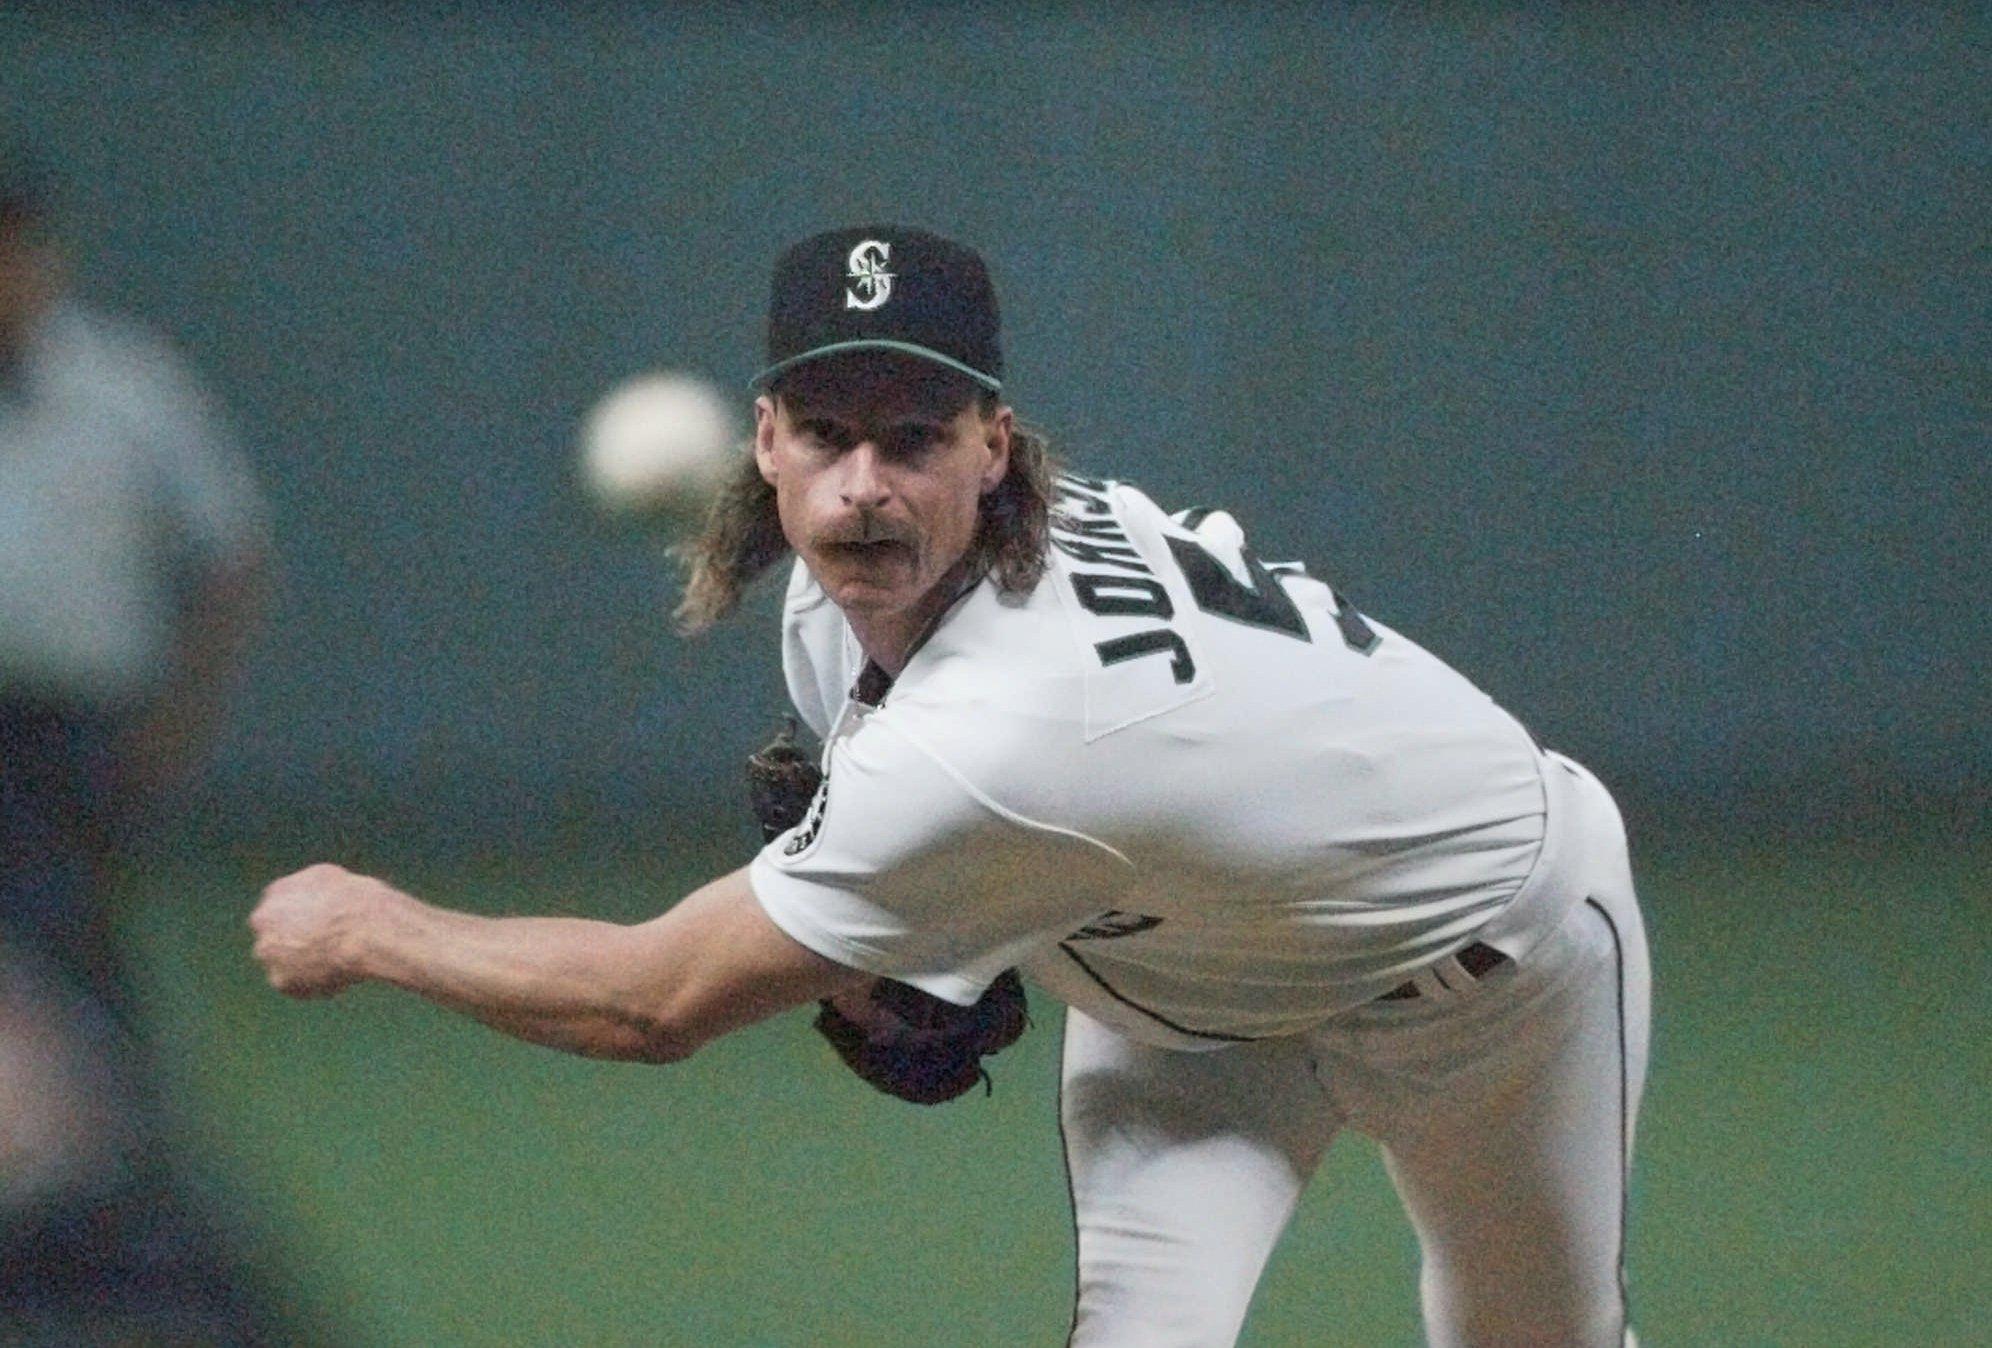
Randy Johnson leads the 2015 hall of fame ballot.  Photo (AP Photo/   Elaine Thompson) via seattlepi.com

Randy Johnson leads the 2015 hall of fame ballot. Photo (AP Photo/ Elaine Thompson) via seattlepi.com

Last year’s version of this post is here; it has links to prior years where I went into my general thought process on yes/no votes per individual player.  I’ve tired of writing the same 2,000 word post on the topic since everyone else on the internet is, so this is a bit shorter of a HoF post.  And it won’t insult me if you don’t respond or even read this post; there’s far, far too much hall of fame arguing going on in the baseball blogosphere, and i’m no more or less qualified to publish an opinion on this ballot than many of the official BBWAA writers at this point.

The 2015 ballot at baseball-reference.com is here.  Once again there’s too many deserving players for not enough spots.

For me, there’s three no-brainer 1st ballot hall-of-famers new to the 2015 ballot: Randy Johnson, Pedro Martinez and John Smoltz.  The first two should be unanimous but of course they won’t.  In fact, we already have a published ballot of someone who left both off so he could vote for others who “needed the votes.”  Smoltz might be borderline for some but for me he’s better than other hurlers recently enshrined; somehow I doubt he gets in this time around.

Of the carry overs from last year’s ballot, I’d vote as follows:

  • Yes for Biggio, Piazza, Bagwell, Raines, Clemens, Bonds, Schilling, Martinez, McGwire
  • Maybe later for Trammell, Mussina, Kent, and Sheffield.
  • No for Smith, McGriff, Walker, Mattingly, Sosa and anyone else new to the ballot this year not otherwise mentioned.  Why are these No votes?  See 2012 and 2013′s links for my reasoning on the names here, all of whom are repeats.

Of course, this is too many “Yes” votes.  If I had to cut two of my 12 Yes votes, I’d guess Martinez and McGwire are the first two to go.  Or maybe Schilling.  Which is a shame because I think all the guys in the “maybe later” have legitimate cases too.  But this is the bed that the BBWAA has made for itself with its arbitrary player limit and its wishy-washy stance on alleged PED users.

2015 voting Prediction: Johnson, Martinez and Biggio elected.  Smoltz just misses, and Piazza & Bagwell get close enough that they’ll go in with the 2016 class (which only has one no-brainer candidate in Ken Griffey, Jr).  Still no love for Bagwell, the PED brothers, or Raines, much to the chagrin of the sabr-crowd.

1/6/15 update: My prediction was too conservative: Johnson, Martinez, Smoltz and Biggio inducted in 2015.  Piazza got 69% of the vote and seems like a good bet for 2016.  however Bagwell and Raines lagged seriously behind, at just 55% of the vote each.  Another huge gap after that leads to a trio of players in the mid 30s … not nearly enough to talk about them getting in next year.

Would you have pulled Zimmermann?

25 comments

This picture is 2 years old; replace it with a red jersey and you would have thought it was last night.  Photo Andrew Harnik/washingtontimes.com

This picture is 2 years old; replace it with a red jersey and you would have thought it was last night. Photo Andrew Harnik/washingtontimes.com

On his 100th pitch of what I certainly thought was going to be a 3-hit shutout masterpiece to resurrect this playoff series for the Nats, Jordan Zimmermann missed on a fastball up to Giants #2 hitter Joe Panik, issuing his first walk and just the fourth base-runner of the night.

I was not entirely shocked to see Matt Williams trot to the mound, but I also wasn’t happy.  As my wife can attest, I uttered the following phrase: “I think he’s going to regret taking him out.”

Sure enough.  Another Drew Storen meltdown, another blown 9th inning lead that led to the team snatching defeat from the jaws of victory.

To be fair; this isn’t entirely about second guessing.  You can quite easily make the argument to put in Storen as thus: Storen has been lights out for the entire year.  The Giant’s most dangerous hitter (Buster Posey) was coming to the plate.  You would rather have Posey going at a fresh Storen than getting his 4th look at Zimmermann (most starters’ third time through the lineup averages inflate wildly, to say nothing of their 4th).  It was righty-versus-righty.

Well, sometimes you can over-think things.  Certainly Tom Boswell feels that way, based on his column this morning.

On the other hand, if the following scenarios had played out, I’m not sure anyone would have argued against the strategy.

  1. After giving up the walk, Williams walks out to talk to Zimmermann, he stays in and gives up the Posey single, *then* Storen comes in and gives up the run-scoring double to Pablo Sandoval.  You’ve yanked the starter after putting two guys on, and you’ve gone to your closer in the highest-leverage situation of his career and he got unlucky.  That’s still harsh on Storen, but more understandable.
  2. After giving up the walk, Williams leaves Zimmermann in like a total old-school manager and watches him subsequently give up the single and then the double, all while his closer warms up in the bullpen.  That would have led to the reverse second-guessing; why leave him in when you’ve got your closer ready to go?

Major league manager; sometimes you just can’t win.  Williams had a quick hook last night.  Don Mattingly had an excruciatingly slow hook two nights ago, letting his ace Clayton Kershaw give up *SIX* hits in the 7th inning of the Dodgers-Cardinals series before relieving him, and then watched his reliever give up a 3-run homer to turn a 6-2 lead into a 7-6 deficit.  That’s “lose your job” kind of decision making (if the Dodger’s don’t get out of the NLDS).

You guys know what I follow and am most interested in; starting pitching.  So you probably know what I would have done; stick with my starter.  But sometimes it isn’t that simple.  So I’m not going to kill Williams for last night.  I do think Storen’s future with this team is in serious doubt; would you throw him again this post-season?  Would you trust him going forward?  Fool me once, shame on you, fool me twice …. and I see Storen in a new uniform next year.

I spent 6+ hours watching that baseball game (practically the first time all summer I have watched a game from start to end).  The longer I watched, that more and more looked like it was going to be the inevitable disappointment, as Yusmiero Petit looked like the second coming of Roger Clemens and the Nats hitters looked like a AAA team at the plate for much of the night.  A deflating end to a long night.  Tanner Roark gave up the game-winning homer on a mistake (he missed over the plate while trying to hit the outside corner and Brandon Belt destroyed it), but the offense had more than their share of walk-off opportunities.

The Nats have a long road ahead; they match up with the Giant’s Ace next, have to win 2 straight on the road just to get it back to a 5th game.  Lets see if they have what Tim Hudson implied they may not have: I can’t say it here in a PG blog but it rhymes with “Walls.”  🙂

Pitcher Wins on the FA Market – 2014 edition with bWAR

leave a comment

Kershaw's new $30M/year contract will be tough to live up to.  Photo via wiki.

Kershaw’s new $30M/year contract will be tough to live up to. Photo via wiki.

One of my pet projects of recent years has been to track “major” Starting Pitcher free agent contracts and then to do analysis of how they turned out, on a Dollar per Win basis.  This post is an updated version of this analysis to determine some of the “best” and “worst” free agent contracts ever awarded to starting pitchers.  It is updated for 2014 from last year’s version of the post by my putting in all the 2013 data for pitchers, plus putting in the significant 2014 FA contracts.  And, per requests I have added in bWAR and $/bWAR for analysis (though, as we’ll soon see, $/bWAR can be tricky to interpret for really poor performing pitchers).

The raw data spreadsheet is available in Google Docs at this link, or along the side of this blog window in the NAR Creation links section.  I havn’t cut and pasted any of the data here because the spreadsheet is too “wide” for the blog; I suggest opening it up in a separate tab while reading this post.

Data Taxonomy/caveats: For ease of analysis, I depend on the Average Annual Value (AAV) of the contracts as opposed to trying to figure out exactly how many wins were earned in which year of a varying contract amount.  Therefore (for example), Gio Gonzalez‘s contract may have only paid him $3.25M in 2012 but I’m using the full AAV of $8.4M for the purposes of the analysis (it would just be far too difficult to calculate each pitcher’s dollar per win on an annualized basis otherwise).  This analysis focuses heavily on dollars per pitcher Win, despite the known limitations of the win stat.  There is also dollars per Quality Start and now dollars per bWAR (baseball-reference’s version of WAR).

Here’s some interesting facts, that come out of this analysis (some of these points can also be seen at the amazing Cots Salary database, now at Baseball Prospectus, and are confirmed in my spreadsheet tracking the same):

Largest total Starting Pitcher Contracts ever signed

  • Clayton Kershaw‘s new 7yr/$214M deal signed this past off-season.
  • It beats out the previous record holder (Felix Hernandez‘s  7 year, $175M extension) by nearly $40M in total value.
  • CC Sabathia (7yrs/$161M in 2009) was the longer-time previous record holder before that.
  • Zack Greinke (6yr/$147M)  and Cole Hamel‘s 6yr/$144M contract deserve mention.
  • Masahiro Tanaka signed one of the biggest ever deals (7 year $155M) before he ever threw a MLB pitch.

Largest Single-Season AAV

  • Kershaw’s new deal finally beats out Roger Clemen‘s long standing single season record 1yr/$28M deal in 2007 as the largest AAV pitcher contract.  
  • Justin Verlander‘s new deal gives him an AAV of $28M, a 10% jump up from the $24-$25M/year threshold deals we saw a number of pitchers sign in the last couple of years.

What are some of the Worst Deals ever made?  Lets talk about some of these awful deals on a $ per win or $ per bWAR basis.  Most of these contracts are well known to baseball fans and are commonly thrown around when talking about the worst historical FA contracts, but they’re fun to revisit.  Thanks to the bWAR inclusion, a number of new/more recent contracts now pop up on this list.

  • Kei Igawa‘s 2007 deal with the Yankees, which was 5yrs/$20M but included a $26M posting fee, is generally speaking the worst $AAV per Win contract ever signed.  Igawa went 2-4 in 13 starts over the life of this 5 year deal, equating to $23M per win for his team.  He made exactly one quality start, meaning the Yankees paid $46M per QS.He spent the last two seasons of this contract buried in AAA.   For their $46M, the Yankees got a combined -0.6 bWAR out of Igawa.
  • Chris Carpenter signed a 2yr/$21M extension in St. Louis before the 2012 season that seemed like a good deal at the time; unfortunately for both sides Carpenter hurt his shoulder, only made 3 starts in 2012, went 0-2 and contributed a -2.3 bWAR in that time.  So his dollars per win is infinite and his $/bWAR is uncalculatable.  I still rank Igawa’s deal as worse though since it cost his team more than double the dollars, and since Carpenter’s troubles were injury related while Igawa’s was mostly due to performance.
  • Jason Schmidt‘s 3yr/$47M contract with the Dodgers.  Schmidt made 10 total starts and went 3-6, equating to $15.6M per win.  He totaled a -0.5 bWAR during this 3 year contract.
  • Oliver Perez made just 21 starts (and got 3 wins in the duration of his 3 year/$36M contract with the Mets.  He was released in March of 2011, the final year of the contract, causing the Mets to eat $12M in salary.  The Nats picked him up and carried him on their AA roster all year before dumping him as well; he’s now trying to remake himself as a loogy and is in Arizona’s bullpen.
  • Matt Harrison‘s current deal (so far) has been pretty expensive for the Rangers: for $11M in salary in 2013 they got just two starts and two bad losses before he hit the D/L and missed the remainder of the season.  He still hasn’t returned.  Odds are he recovers and has a chance to earn this contract, but you never know with shoulder injuries (though to be fair the injury that cost him 2013 was a ruptured disk in his back).
  • Tim Lincecum‘s recently completed 2yr/$40.5M contract was pretty ugly for San Francisco; he went 20-29, had just a 43% Quality Start percentage and contributed -2.3 bWAR over those two seasons for his $40M.
  • Barry Zito signed a 7yr/$126M deal.  In those 7 years he went 63-80 and contributed just 3.0 bWAR in the lifetime of the contract.  That’s $42M per win.  By way of comparison, Tanner Roark‘s 5 weeks of effort for the Nats last summer totaled 2.0 wins.
  • Mike Hampton‘s injury plagued/ill conceived 7yr/$121M contract resulted in two full missed seasons and just a grand total 3.0 bWAR of value.
  • Edwin Jackson and Dan Haren both managed to put up negative bWAR for their 2013 seasons (for which they were both being paid $13M a piece).  But those are just one-year deals; they aren’t the multi-year disasters that these other contracts can be.
  • Chan Ho Park signed a 5yr/$65M deal with the Dodgers; for those $65M the Dodgers got precisely 0.2 total bWAR in 5 seasons.  That’s right; for that money they could have fielded a 4-A pitcher and gotten comparable value.  Park was 33-33 during that time and missed significant time with injury.
  • Darren Dreifort (6.1M/win and 0.2 bWAR in 5 seasons), Russ Ortiz (4.7M/win and -3.2 bWAR in 4 seasons), Carl Pavano ($4.4M/win and 0.4 bWAR in 4 seasons), and Carlos Silva ($4M/win and -0.7 bWAR in 5 seasons) all had pretty infamous contract disasters too.

How about some of the Best Contracts ever signed?  Lots of players have signed small one year deals and won double-digit games, so those really cannot count.   Starting with an arbitrary floor of a $50M free agent contract, here’s some of the best value FA contracts ever signed:

  • Pedro Martinez: 7yr/$92M, during which he went 117-37 for the Red Sox for a $786k/win total.
  • Justin Verlander‘s 5yr/$80M deal from 2010-2014 will be a steal for Detroit: he’s already contributed 25+ bWAR and is at about $888k/win.  The same probably will not be said about his mammoth $140M extension.
  • Mike Mussina went 92-53 in his 6yr/$88.5M contract for $961k/win.
  • Chris Carpenter‘s 4yr/$50.8M deal from 2008-2011 was a steal for St. Louis: He may have missed some time but he still went 44-23 during that contract, contributed 13.6 bWAR and his $/win number was just $1.1M.  He’s the only guy who appears in both the “best contracts” and “worst contracts” section in this post.
  • Mark Buehrle‘s 4yr/$56 deal from 2008-2011 resulted in about a $1M/win and just $3.2M/bWAR, great value for his team despite his mediocre looking 54-44 record.
  • Jered Weaver, Yu Darvish, and Hyun-Jin Ryu deserve  mention here; they’re all in the early stages of their long-term contracts and are easily providing value in terms of $/win.

So what does this data mean?  Here’s some conclusions when talking about Dollars per Pitcher Win.

  1. Up to perhaps the mid 2000s, if you got about one (1) pitcher Win per million dollars spent on a player in the Free Agent market that you were doing great.
  2. Now, if you’re getting anything under $1.5M per win, you should be happy.  Especially if you’re paying an ace $25-$30M/year.
  3. Anything over $2M/win is usually considered a bust.  Nearly every contract in the $2M/win in AAV and above has been mentioned and criticized as being a bad contract; the list of “worst ever” above starts at $4M/win and goes higher.
  4. If you pay a starter anything more than about $25M/season,  you’re really going to have a hard time getting value back.  There’s only been a handful of 20-game winners over the past 5 years or so, but paying a starter $24M like Greinke is getting is almost certainly going to be regretted at some point.  An injury or a lost season completely blows the $AAV/win.
  5. It illustrates more clearly than anywhere else the value of a top-notch, pre-Arbitration starter.  Take Clay Buchholz for example; in 2010 he was 17-7 while earning the league minimum of $443k.  That equates to $26,059/win on the same staff that was busy paying Daisuke Matsuzaka $2.06M per win (when adding in the $52M posting fee).  Buchholz has struggled with injuries since then, but teams that  lock down and depend on these pre-arb starters save untold amounts of FA dollars as a result.
  6. This analysis is nearly impossible to do across baseball eras because of the general inflation of contracts and especially because of the bonanza of FA dollars being thrown out there right now.  Pedro Martinez at the top of his game signed a 7yr/$92M deal.  Imagine what he’d get today?  It could be three times that considering how good he was in comparison to his counterparts in the mid 90s.  He was coming off a 1997 season in which he struck out 305 batters, had a 1.90 ERA, a 219 ERA+ and won the Cy Young award.  So going forward a general $1.25M/win is a more accurate barometer for whether or not a pitcher has “earned” his contract.  But there’s no easy way to draw a line in the free agency sand and say that before yearX $1M/win was a good barometer while after yearY $1.25M/win is a good barometer.
  7. A caveat to the $1M/win benchmark; there are different standards for obtaining wins.   If you sign a $3M 1 year deal and then subsequently go 3-12 with a 6.00 ERA … while it looks like you reached the $1m/win threshold in reality you were, well, awful.  This analysis only really holds up for major FA contracts paying in excess of $10M/year.

And here’s some discussions on Dollars per WAR, since we’ve added that in for this 2014 analysis.

  1. The general rule of thumb is that “wins” in terms of WAR “cost” is somewhere between $6M and $7M on the open market.  Did $6M/win work out in this analysis?  Yes and no; it is sort of difficult to do this analysis with players badly underperformed.  Take for example John Danks: he’s two years into a 5yr/$65M contract where he’s gotten hurt in both seasons and has just 7 wins and a 0.7 bWAR.  Well, $26M in total salary paid so far for 0.7 bWAR equals a $37M/war figure.  Well that’s not quite right.
  2. The best you can do is look at player-by-player examples.  Johan Santana‘s 6yr/$137.5M contract cost his team $9M/bWAR.  That’s unquestionably bad.   Cole Hamels went 17-6 in 2012 on a 1yr/$15M deal, which turned out to be just $3.2M per WAR for his 4.2 bWAR season.  That’s great.
  3. The $/bWAR analysis gets worse if the bWAR is negative; our own Dan Haren came in with a -0.01 bWAR for 2013; how do you decide how much the Nationals paid on a dollar-per-bWAR basis for Haren?  If you divide 0.01 into his $13M salary you get a non-sensical -$1.3 billion figure.


Lastly, for comparison purposes, here’s the above analysis looks for the 2013 Nationals pitching staff.  Keep in mind that the $/win figures for pre-arbitration pitchers vastly skew the analysis (apologies if this bleeds off the side of the browser screen)

Last Name First Name Total Value (includes guaranteed $) $$/year AAV Contract Term Years Into Contract Starts QS QS % W L $ per start $ per QS $ AAV per win Total bWAR $ per bWAR
Strasburg Steven $19,000,000 $4,750,000 2009-13 5 75 46 61.3% 29 19 $316,667 $516,304 $818,966 8.5 $2,794,118
Gonzalez Gio $42,000,000 $8,400,000 2012-16 2 64 43 67.2% 32 16 $262,500 $390,698 $525,000 7.9 $2,126,582
Zimmermann Jordan $5,350,000 $5,350,000 2013 1 32 21 65.6% 19 9 $167,188 $254,762 $281,579 3.7 $1,445,946
Detwiler Ross $2,337,500 $2,337,500 2013 1 13 6 46.2% 2 7 $179,808 $389,583 $1,168,750 0.1 $23,375,000
Haren Dan $13,000,000 $13,000,000 2013 1 30 15 50.0% 10 14 $433,333 $866,667 $1,300,000 0.0 (0 war)
Maya Yunesky $8,000,000 $2,000,000 2010-13 4 10 1 10.0% 1 4 $800,000 $8,000,000 $8,000,000 -0.8 ($10,000,000)
Karns Nathan 490,000 490,000 2013 1 3 0 0.0% 0 1 $163,333 (0 QS) (0 wins) -0.4 ($1,225,000)
Jordan Taylor 490,000 490,000 2013 1 9 3 33.3% 1 3 $54,444 $163,333 $490,000 0.0 (0 war)
Ohlendorf Ross 1,000,000 1,000,000 2013 1 7 3 42.9% 3 1 $142,857 $333,333 $333,333 0.9 $1,111,111
Roark Tanner 490,000 490,000 2013 1 5 4 80.0% 3 1 $98,000 $122,500 $163,333 2.0 $245,000

The counting figures for Starts/QS/Wins/Losses are cumulative for the life of whatever contract the player is on.  So for Strasburg, he was basically in the 5th year of his original 5 year deal, hence the 75 total starts in those 5 years.

The 2013 Nats have $AAV per win and $/bWAR mostly on the good side:

  • Yunesky Maya and Nathan Karns both contributed negative bWAR for 2013, so their numbers are meaningless.
  • Taylor Jordan and Dan Haren both came in at zero (or close enough to it) bWAR, so their numbers are also meaningless.  Well, not “meaningless” in Haren’s case: basically he gave the team replacement performance for his $13M in salary; the team could have just called up a guy from AAA and let him pitch all year and gotten about the same value.  Thanks for the memories!
  • The best $/win guy was Tanner Roark, who got 3 wins for his MLB minimum salary … and that’s not even taking into account the fact that Roark’s 2013 salary probably should be pro-rated for this analysis.
  • The worst $/win guy was  Maya; who demonstrated yet again that his $8M contract was a mistake.
  • Nearly the entire staff has $/win values under the “you’re doing well” threshold of $1M/win.  And nearly the whole squad is doing $/bWAR well below the $6M/bWAR range.


Have we seen the last 300-game winner? (updated post 2013 season)

4 comments

Sabathia remains the best chance for another 300-game winner .. Photo wiki/flickr chris.ptacek

Sabathia remains the best chance for another 300-game winner .. Photo wiki/flickr chris.ptacek

Welcome to the latest installment of  the “Will we ever see another 300-game winner” post.

(Aside; yes I know the limitations of the “win” statistic.  However, nobody looks at a 20-game winner on the season or a 300-game winner for his career and excuses it as a statistical aberration; the pitcher win will continue to be important to players and in the lexicon of the game for years to come, despite Brian Terry‘s #killthewin campaigns).

Of the 24 pitchers in the game’s history to have reached the 300-game plateau, 4 of them have done it in the last decade (they being Randy Johnson, Roger Clemens, Greg Maddux, and Tom Glavine).  However, there exists a distinct belief in the game that we may not see another 300-game winner for some time, thanks to pitch count obsessions, innings limits, 5-man rotations, NL small-ball managing, match-up relievers and generally a huge rise in bullpen usage over the last 20 years.

In the past year, I’ve collected some topical reading related to this post:

When we first broached this topic (in April 2009), Sabathia was still the best bet (outside of Randy Johnson, who sat at 296 before the 2009 season began), but it didn’t look that good for anyone else to reach the plateau, and a couple of the names we guessed as having an outside shot (Ervin Santana and Scott Kazmir) seem like ridiculous choices now.  When we most recently broached this topic (at the end of the 2012 season), we explained some statistical models we and others were using to try to predict who may have the next best shot at reaching the mark.  We concluded that Sabathia and Hernandez were both pretty good guesses at the time to reach the plateau.

How are things looking now?

I maintain a spreadsheet (uploaded to google and/or available via the links to the right of this page) that ranks candidates using a couple of formulas inspired by Jay Jaffe (see 2012’s post for the full thought process behind them).  Basically Jaffe’s prediction models assume that the pitcher can win X games per year after a set age (in Jaffe’s case, his simple formula assumes pitchers win 15 games/year until their age 42 season, a relatively optimistic projection and hence why he self-titles it using the words “blindingly optimistic”).  I’ve used a couple other methods to rank pitchers (calculating average number of wins past the age of 18 or 23, but since some guys get drafted out of HS and debut at 20 or 21 these projections end up looking ridiculous), in order to find candididates to put into the discussion.  I also don’t really even consider a guy until he gets to 50 career wins, so there’s no wild speculation about someone like Shelby Miller (15 wins in his age 22 season) or Jose Fernandez (12 wins in his age 20 season).

So, without further ado, here’s a list of starters right now who are in the conversation of possibly reaching 300 wins in their career and my % chance opinion of getting there.

pitcher age wins % Chance of making 300 wins
CC Sabathia 32 205 75%
Clayton Kershaw 25 77 50%
Felix Hernandez 27 110 10%
Justin Verlander 30 137 10%
Madison Bumgarner 24 49 5%
Trevor Cahill 25 61 5%
Zack Greinke 29 106 5%
Mark Buehrle 34 186 1%
Rick Porcello 24 61 0%
Yovani Gallardo 27 81 0%
Matt Cain 28 93 0%

Thoughts per starter:

  • CC Sabathia remains the pitcher with the best chance of reaching 300 wins, but i’ve downgraded his probability from last year’s 90% to just 75% right now.  Why?  Well read no further than the link about his 2013 decline, where his FB velocity dropped, his ERA rose and he posted a sub 100 ERA+ value for the first time in his career.  He still won 14 games, but his win totals have declined four years in a row.   On the plus side, he’s a workhorse pitching for a team that historically has a great offense, which enables him to get wins despite an inflated ERA (he had 4 or more runs of support in 20 of his 32 starts in 2013 … Stephen Strasburg just started crying).   It still seems entirely plausible he can average at least 10-12 wins for the next 7 seasons and hit the milestone before hanging them up.
  • Clayton Kershaw improves his probability of hitting the plateau from last year to this year based on two factors: First, he has clearly stepped up and is now the pre-eminent starter in the game and seems set to continue to post 16-20 win seasons for the extended future.  Secondly, the Dodgers now spend money like no other, ensuring a winning team that gets Kershaw victories even if he’s not pitching his best.  He was “only” 16-9 in 2013; I would expect him to put up more wins each season in the next few years, and I wouldn’t be surprised to see him with 160 career wins before he’s 30.
  • Felix Hernandez‘s chances have plummetted; going from 75% last year to just 10%.  Why such a precipitous drop?  Two factors; first he took a noted step back in FB velocity this year, to the point where pundits were questioning his arm strength.  Secondly, he signed a massive deal to stay in Seattle … and Seattle right now is not a winner.  It has a completely dysfunctional ownership and management group and seemingly has no idea how to put together a baseball team.  They’re competing in a division of teams with better management willing to spend more money, and these factors are going to continue to have Hernandez put up the 13-14 win seasons he has been doing for the last four years.  He’s already 27: if he’s doesn’t have back to back 20 win seasons his chances are kaput.
  • Justin Verlander, like Hernandez and Sabathia, also had a curious drop in performance in 2013, leading me to drop his 300-game chances from one in three to one in ten.  At age 30 he has logged just 137 wins and has gone from 24 to 17 to 13 in the last three seasons.  If he can right the ship and get back to the 18-20 game win plateau, he can get his 300-game mojo back, but at age 30 he’s less than halfway there, so chances are looking pretty slim.
  • Madison Bumgarner appears here mostly because of his advanced win totals at such a young age; he already has 49 career wins before his 24th birthday.  He’s averaging 14 wins a season so far, and with a 14 win average in every season between now and his age 40 year he’d hit his mark.  But I have his chances right now at only 5%; its just too early to really tell if Bumgerner will have the endurance and continued success to get there.  Plus, is Bumgarner an elite starter or more in the mold of a Mark Buehrle (i.e., a durable lefty who grinds out 13-14 win seasons for a decade)?
  • Trevor Cahill is in nearly the same boat as Bumgarner, except that I don’t think he’s quite as good.  In fact, Cahill seems like he’s bound for Mark Buehrle territory (see below); an innings eating guy who is always right around the 13-12 mark each season.  If he does this for the next 15 years, he may get close.  I give him a slight chance.
  • Zack Greinke has gone from not even being considered to having a 5% chance.  Why?  Well he’s signed a huge long term deal with a very good team AND he now pitches in both the NL and in a pitcher’s park.   In 2013 he put up a very quiet 15-4 record and I think with his stuff and his health he could put up multiple 16-18 win seasons.  That’d get him to the mid 200s by the time he’s nearing 40 … maybe enough to have him go for it while pitching into his early 40s.  Or maybe not; by the time he’s 40 he’ll likely have nearly $250M in career earnings and may just buy a ranch somewhere.
  • Mark Buehrle‘s career 162 game average W/L record (14-11) is identical to Bumgarner’s.  In his last 5 season’s he’s won 13 games four times and 12 games once.  I have given him a 1% chance of hitting 300 on the off-chance that he pitches well into his mid 40s, continues to put up 4th starter figures and finishes with a career record of something like 302-285.  He doesn’t miss many starts, so perhaps he’s that durable.
  • The last three guys mentioned (Rick PorcelloYovani Gallardo and Matt Cain) are all given 0% chances at this point but are listed thanks to their advanced win totals by their mid 20s.  Cain’s sudden drop off in 2013 (a common theme in this list) has seemingly cost him any shot at reaching 300 wins despite his normal sturdiness.  Gallardo had a 10% chance last year and drops to zero thanks to my having almost no confidence that he is a good enough pitcher to accumulate enough wins going forward.  And Porcello remains essentially a 5th starter who just happened to matriculate to the majors at the tender age of 20.  I can see him having a career similar to Buehrle’s; long tenures of near .500 record. In fact, ironically Porcello’s 162-game average W/L record is identical (14-11) to Buehrle’s … which is also identical to Bumgarner and very close to Cahill’s.  I think there’s something clearly “accumulator” in nature to all these guys.

What has happened to some of the candidates from last year not mentioned yet?

  • Roy Halladay went from a near Cy Young season in 2011 to retirement in just two short seasons.  Shoulder injuries are a killer.  He retires with 203 wins.
  • Chad Billingsley lost nearly the entire 2013 season to injury, scuttling what dim chances he had.  He’s now not even guaranteed a spot in LA’s high powered rotation.
  • A bunch of veterans who already had little chance (but were mentioned anyways) have now retired: Jamie MoyerLivan HernandezAndy Pettitte, and Kevin Millwood.
  • Tim Hudson is an interesting case; he sits at 205 wins, lost a chunk of last season to injury but signed on in a pitcher’s park in SF.   He’s gotten 17,16 and 16 wins the last three seasons in his mid 30s; can he just continue to get 16-17 win seasons and suddenly be looking at 300 wins by the time he’s 42?  Maybe, but he’s going to have to be good these next two seasons.

Thoughts?  Do you care about 300 winners like I do, or is it just an anachronism of baseball history that will go the way of 300 strikeouts, 30-wins and hitting .400?


2014 Hall of Fame Ballot Obligatory Post

21 comments

Its Morris' 15th year; its now or never.  Photo John Iacono via si.com

Its Morris’ 15th year; its now or never. Photo John Iacono via si.com

Before starting, if you hadn’t heard Deadspin has bought a Hall of Fame vote this year and is going to submit it as populated by crowd sourcing.  Click on this link to go to Deadspin.com’s page to vote.  Voting at deadspin ends on 12/28/13 and all hall of fame ballots are due to be mailed back to the BBWAA by 12/31/13.  The class of 2014 will be announced later in January.

Everyone else has a post about how they’d vote if they had a BBWAA ballot.  Here’s mine.  Only its slightly different from how i’ve done these in the past.

Joe Posnanski has put out a survey in October 2013 that anyone can take that simply asks you to rank the 2014 candidates 1-10.  It is an interesting exercise because it very quickly highlights the depth of the ballot, since as everyone knows, there are many very deserving candidates who are outside the top 10 and who may very well fall off the ballot this year because of the glut of candidates.  It also makes you think; if you rank your candidates 1 to 10 … how many names would you be leaving off your ballot that you’d want to vote for?

So, instead of doing a “who’s on/who’s off” post like i’ve done in years past (and like everyone else does) here’s a different take driven by Posnanski’s ranking question.

My first 8 “Yes Votes” were relatively easy: Maddux, Bonds, Clemens, Thomas, McGwire, Bagwell, Glavine, Piazza.  I don’t think there’s one of those 8 candidates who shouldn’t be a slam dunk hall-of-famer based on baseball accomplishments.   (That most all of them likely do not get in because of PED suspicions is another story).  The only one of my top 8 that doesn’t match with Posnanski’s survey results is McGwire (replace him with Raines, everyone’s favorite Bert Blyleven-style charity case for getting more support).

Then I got stuck.  Who were the last 2 I’d put on the ballot?  Lets look at the rest of the 2014 ballot:

  • Voting No altogether: Walker, McGriff, Palmeiro, Smith, Sosa and anyone else new to the ballot this year not otherwise mentioned.  Why are these No votes?  See 2012 and 2013’s links for my reasoning on the 5 names here, all of whom are repeats.
  • Remaining Pitchers in order that I’d likely vote them in: Schilling, Morris, Mussina
  • Remaining Hitters in the order that I’d likely vote them in: Raines, Martinez, Kent, Biggio, Trammell

So I guess my last two would likely be Schilling and Raines, or perhaps Raines and Martinez.

Man, tough ballot this year.

If there wasn’t a 10-person limit, then I’d go crazy and probably vote for 16 candidates, basically the first 8 plus all the other “remaining” players above.   I’m by no means a “small hall” person, and I’m also not obsessed with the stat-driven arguments against Morris.  I think all these guys merit a plaque in Cooperstown.

Coincidentally, to all those people who write 1,000 words on all the things the BBWAA should do to fix the congestion issue (expand beyond 10 names, remove the 5% threshold), just stop wasting your time.  Year after year the BBWAA stays in the news for weeks at a time exactly because they refuse to change the standards.  Why would they relent now?

If you want to read how I’ve weighed in on the Hall votes in year’s past, here’s some links:

And lastly, I have a huge draft post dated from Dec 2011 with pictures from my actual visit to the Hall of Fame that I started but never finished (mostly because adding pictures to WordPress is a huge pain in the *ss).  Maybe I’ll get bored, finish it up and post that in conjunction with the 2014 class announcement.

Pitcher Wins on the Free Agency Market; an analysis

3 comments

Is Greinke's big new deal going to pay off for the Dodgers? We'll see. Photo Jeff Golden/Getty Images

One of my pet projects of recent years has been to track “major” Starting Pitcher free agent contracts and then to do analysis of how they turned out, on a Dollar per win basis.  This post is an analysis of this work along with some interesting conclusions to determine some of the “best” and “worst” free agent contracts ever awarded.

This is mostly an analysis of past performance; there’s plenty of pitchers right now on major contracts that are just too soon into the deal to really draw any conclusions.  I’ve included in the spreadsheet all the major contracts signed this past off-season and will continue to do so if these guys get significant deals.  But we’ll have to wait a year to see how the first year of the contracts play out.  For all contracts that are in the middle of being played out, I’ve calculated how that contract is faring thus far.

Some caveats to the data:  For ease of analysis, I depend on the Average Annual Value (AAV) of the contracts as opposed to trying to figure out exactly how many wins were earned in which year of a varying contract amount.  Therefore (for example), Gio Gonzalez‘s contract may have only paid him $3.25M in 2012 but I’m using the full AAV of $8.4M for the purposes of the analysis (it would just be far too difficult to calculate each pitcher’s dollar per win on an annualized basis otherwise).  Also, I focus on dollars per Win, despite the known limitations of the “Win” statistic.  I have gone through and added in Quality Starts to the analysis, but that stat is also flawed in some respects (though it does do a pretty good job of indicating whether or not the starter has done his job).  Unfortunately the $/QS doesn’t work out as nicely as $/Win, since Pitcher Wins are still so prevalent in our player analysis.  I mean, after all, the goal of the game is to WIN the game, right?

Here’s a quick cut-n-paste from the spreadsheet (which is also available in the Links section to the right and on Google Docs) of some selected fields.  See the Google xls for everything.  Apologies if this doesn’t present well online.  The table is listed in descending order of $/year AAV.  Blanks in the Wins and $AAV per win indicate that the contract has yet to begin.  I also threw in a couple of non-FA contracts at the end to show what a MLB-minimum successful starting pitcher looks like in comparison.

Last Name First Name Total Value (includes club options) $/year AAV Contract Term Wins $ AAV per win
Clemens Roger $28,000,022 $28,000,022 2007 6 $4,666,670
Greinke Zack $147,000,000 $24,500,000 2013-2018
Sabathia C.C. $122,000,000 $24,400,000 2012-16 15 $1,626,667
Lee Cliff $120,000,000 $24,000,000 2011-15 23 $2,086,957
Hamels Cole $144,000,000 $24,000,000 2013-18
Sabathia C.C. $69,000,000 $23,000,000 2009-11 59 $1,169,492
Santana Johan $137,500,000 $22,916,667 2008-13 46 $2,989,130
Cain Matt $127,500,000 $21,250,000 2012-17 16 $1,328,125
Lincecum Tim $40,500,000 $20,250,000 2012-13 10 $2,025,000
Halladay Roy $60,000,000 $20,000,000 2011-13 30 $1,333,333
Darvish Yu $111,700,000 $18,616,667 2012-18 16 $1,163,542
Zambrano Carlos $91,500,000 $18,300,000 2008-12 50 $1,830,000
Zito Barry $126,000,000 $18,000,000 2007-13 58 $1,862,069
Clemens Roger $18,000,000 $18,000,000 2005 13 $1,384,615
Peavy Jake $52,000,000 $17,333,333 2010-12 25 $2,080,000
Matsuzaka Daisuke $103,000,000 $17,166,667 2007-12 50 $2,060,000
Beckett Josh $68,000,000 $17,000,000 2011-14 20 $1,700,000
Weaver Jered $85,000,000 $17,000,000 2012-16 20 $850,000
Lackey John $82,500,000 $16,500,000 2010-14 26 $1,903,846
Burnett A.J. $82,500,000 $16,500,000 2009-13 50 $1,320,000
Verlander Justin $80,000,000 $16,000,000 2010-14 59 $813,559
Sanchez Anibal $80,000,000 $16,000,000 2013-17
Schmidt Jason $47,000,000 $15,666,667 2007-09 3 $15,666,667
Hernandez Felix $78,000,000 $15,600,000 2010-14 40 $1,170,000
Wilson C.J. $77,500,000 $15,500,000 2012-16 13 $1,192,308
Hampton Mike $121,000,000 $15,125,000 2001-08 56 $2,160,714
Brown Kevin $105,000,000 $15,000,000 1999-05 72 $1,458,333
Lowe Derek $60,000,000 $15,000,000 2009-12 49 $1,224,490
Hamels Cole $15,000,000 $15,000,000 2012 17 $882,353
Kuroda Hiroki $15,000,000 $15,000,000 2013
Mussina Mike $88,500,000 $14,750,000 2001-06 92 $961,957
Oswalt Roy $73,000,000 $14,600,000 2007-11 61 $1,196,721
Buehrle Mark $58,000,000 $14,500,000 2012-15 13 $1,115,385
Peavy Jake $29,000,000 $14,500,000 2013-14
Buehrle Mark $56,000,000 $14,000,000 2008-11 54 $1,037,037
Martinez Pedro $54,000,000 $13,500,000 2005-08 32 $1,687,500
Halladay Roy $40,000,000 $13,333,333 2008-10 58 $689,655
Martinez Pedro $92,000,000 $13,142,857 1998-04 117 $786,325
Danks Jon 65,000,000 $13,000,000 2012-15 3 $4,333,333
Park Chan Ho $65,000,000 $13,000,000 2002-06 33 $1,969,697
Dempster Ryan $52,000,000 $13,000,000 2009-12 48 $1,083,333
Haren Dan $13,000,000 $13,000,000 2013
Jackson Edwin $52,000,000 $13,000,000 2013-16
Colon Bartolo $51,000,000 $12,750,000 2004-07 46 $1,108,696
Carpenter Chris $50,800,000 $12,700,000 2008-11 44 $1,154,545
Arroyo Bronson $25,000,000 $12,500,000 2009-10 32 $781,250
Dickey R.A. $25,000,000 $12,500,000 2013-14
Perez Oliver 36,000,000 $12,000,000 2009-11 3 $12,000,000
Silva Carlos $48,000,000 $12,000,000 2008-12 15 $4,000,000
Millwood Kevin $60,000,000 $12,000,000 2006-10 52 $1,153,846
Kuroda Hiroki $12,000,000 $12,000,000 2011 13 $923,077
Pettitte Andy $12,000,000 $12,000,000 2013
Haren Dan $47,750,000 $11,937,500 2009-12 54 $884,259
Kuroda Hiroki $35,300,000 $11,766,667 2008-10 28 $1,260,714
Arroyo Bronson $35,000,000 $11,666,667 2011-13 21 $1,666,667
Lincecum Tim $23,000,000 $11,500,000 2010-11 29 $793,103
Mussina Mike $22,141,452 $11,070,726 2007-08 31 $714,240
Dreifort Darren $55,000,000 $11,000,000 2001-05 9 $6,111,111
Meche Gil $55,000,000 $11,000,000 2007-11 29 $1,896,552
Lilly Ted $33,000,000 $11,000,000 2011-13 17 $1,294,118
Jackson Edwin $11,000,000 $11,000,000 2012 10 $1,100,000
Harrison Matt $55,000,000 $11,000,000 2013-17
Carpenter Chris $21,000,000 $10,500,000 2012-13 0 (0 wins)
Ryu Hyun-Jin $61,700,000 $10,283,333 2013-18
Neagle Denny $51,000,000 $10,200,000 2001-05 19 $2,684,211
Lilly Ted $40,000,000 $10,000,000 2007-10 54 $740,741
Darvish Yu $60,000,000 $10,000,000 2012-18 16 $625,000
Kuroda Hiroki $10,000,000 $10,000,000 2012 16 $625,000
Pavano Carl $39,950,000 $9,987,500 2005-08 9 $4,438,889
Wolf Randy $29,750,000 $9,916,667 2010-12 31 $959,677
Johnson Josh $39,000,000 $9,750,000 2010-13 22 $1,329,545
Greinke Zack $38,000,000 $9,500,000 2009-12 67 $567,164
Washburn Jarrod $37,000,000 $9,250,000 2006-09 32 $1,156,250
Igawa Kei $46,000,000 $9,200,000 2007-11 2 $23,000,000
Cain Matt $27,250,000 $9,083,333 2010-12 41 $664,634
Lowe Derek $36,000,000 $9,000,000 2005-08 54 $666,667
Matsuzaka Daisuke $52,000,000 $8,666,667 2007-12 50 $1,040,000
Beckett Josh $42,000,000 $8,400,000 2007-10 55 $610,909
Gonzalez Gio $42,000,000 $8,400,000 2012-16 21 $400,000
Guthrie Jeremy $25,000,000 $8,333,333 2013-16
Ortiz Russ $33,000,000 $8,250,000 2005-08 7 $4,714,286
Schmidt Jason $40,000,000 $8,000,000 2002-06 71 $563,380
Buchholz Clay $30,000,000 $7,500,000 2012-15 11 $681,818
Lester Jon $43,000,000 $7,166,667 2009-14 58 $494,253
Hamels Cole $20,500,000 $6,833,333 2009-11 36 $569,444
Wainwright Adam $36,000,000 $6,000,000 2008-13 64 $468,750
Ryu Hyun-Jin $36,000,000 $6,000,000 2013-18
Webb Brandon $28,000,000 $5,600,000 2006-10 56 $500,000
Lee Cliff $23,000,000 $4,600,000 2006-10 67 $343,284
Igawa Kei $20,000,000 $4,000,000 2007-11 2 $10,000,000
Jimenez Ubaldo $23,750,000 $3,958,333 2009-14 53 $298,742
Jimenez Ubaldo $10,000,000 $2,500,000 2009-12 53 $188,679
Price David $9,750,000 $1,950,000 2007-11 41 $237,805
Buchholz Clay $555,000 $555,000 2011 6 $92,500
Buchholz Clay $443,000 $443,000 2010 17 $26,059

Here’s some interesting facts, that come out of this analysis (some of these points can also be seen at the amazing Cots Salary database, now at Baseball Prospectus, and are confirmed in my spreadsheet tracking the same):

  • Largest total Starting Pitcher Contract ever signed: Felix Hernandez‘s brand new 7 year, $175M extension, beating out the previous record-holder CC Sabathia (7yrs/$161M in 2009).   Zack Greinke‘s just signed 6yr/$147M would be the 2nd biggest ever signed, and Cole Hamel‘s 6yr/$144M contract the third.  Will our own Stephen Strasburg come close to broaching these limits when he hits the FA market?  We’ll see.
  • Largest Single-Season AAV: Roger Clemen‘s 1yr/$28M deal in 2007.  The next closest are Hernandez’s $25M/year, Greinke $24.5M/year and Sabathia’s $24.4M figures.

(A couple of quick caveats to the above lists: CC Sabathia subseqently opted out of his 7/161 deal, so it basically got turned into a 3yr/$69M deal.  And, techncially Hernandez’s deal ripped up the last two years of his previous deal to replace it with the 7/175 deal; lots of people are looking at the new deal as a 5  year extension with an even higher AAV.  I don’t see it the same way; I see it as a replacement of the existing contract years).

What are some of the worst deals ever made?

  • Worst Ever Starting Pitcher Contract: Kei Igawa‘s 2007 deal with the Yankees, which was 5yrs/$20M but included a $26M posting fee, is the worst $AAV per Win contract ever signed.  Igawa went 2-4 in 13 starts over the life of this 5 year deal, equating to $23M per win for his team.  He spent the last two seasons of this contract buried in AAA.
  • Worst non-Posting fee Starting Pitcher Contract: Jason Schmidt‘s 3yr/$47M contract with the Dodgers.  Schmidt made 10 total starts and went 3-6, equating to $15.6M per win.

Other names on the “Worst Starting Pitcher Contract” category include Oliver Perez ($12M/win), Darren Dreifort (6.1M/win), Russ Ortiz (4.7M/win), Carl Pavano ($4.4M/win) and Carlos Silva ($4M/win).   Most of these contracts are well known to baseball fans and are commonly thrown around when talking about the worst historical FA contracts.

How about some of the “Best” Contracts ever signed?  Lots of players have signed small one year deals and won double-digit games, so those really cannot count.   Starting with an arbitrary floor of a $50M free agent contract, here’s the best value FA contracts ever signed:

  1. Pedro Martinez: 7yr/$92M, during which he went 117-37 for the Red Sox for a $786k/win total.
  2. Justin Verlander: He’s in the middle of a 5yr/$80M contract and for the first 3 years he’s 59-22 for $813k/win.
  3. Mike Mussina went 92-53 in his 6yr/$88.5M contract for $961k/win.

Jered Weaver and Yu Darvish deserve some mention here; they’re both in the first year of $50M+ contracts and are easily earning their pay in terms of $/win.


So what does this data mean?  Here’s some conclusions.

  1. It used to indicate that if you got about one (1) pitcher Win per million dollars spent on a player in the Free Agent market that you were doing great.  Look at our own Edwin Jackson in 2012: we signed him for $11M, he went 10-11 for us, equating to $1.1M/win.  Good value frankly.
  2. If you’re getting anything between $1.25M and $1.5M/win, there may be some complaints about the value of the contract.  Not always, but most of the time it indicates that either the pitcher is underperforming or is overpaid.
  3. Anything over $2M/win is usually considered a bust.  Nearly every contract in the $2M/win in AAV and above has been mentioned and criticized as being a bad contract; the list of “worst ever” above starts at $4M/win and goes higher.
  4. If you pay a starter anything more than about $18M/season,  you’re really going to have a hard time getting value back.  There’s only been a handful of 20-game winners over the past 5 years or so, but paying a starter $24M like Greinke is getting is almost certainly going to be regretted at some point.  An injury or a lost season completely blows the $AAV/win.
  5. It illustrates more clearly than anywhere else the value of a top-notch, pre-Arbitration starter.  Take Clay Buchholz for example; in 2010 he was 17-7 while earning the league minimum of $443k.  That equates to $26,059/win on the same staff that was busy paying Daisuke Matsuzaka $2.06M per win (when adding in the $52M posting fee).  Buchholz has struggled since then, but teams that depend on these pre-arb starters (Tampa, Oakland, Washington to a certain extent) save untold amounts of FA dollars as a result.
  6. Lastly, and this is the hard part, this analysis is getting nearly impossible to do across baseball eras because of the general inflation of contracts and especially because of the bonanza of FA dollars being thrown out there right now.  Pedro Martinez at the top of his game signed a 7yr/$92M deal.  Imagine what he’d get today?  It could be twice that.  He was coming off a 1997 season in which he struck out 305 batters, had a 1.90 ERA, a 219 ERA+ and won the Cy Young award.  So perhaps going forward a general $1.25M/win is a more accurate barometer for whether or not a pitcher has “earned” his contract.  But there’s no easy way to draw a line in the free agency sand and say that before yearX $1M/win was a good barometer while after yearY $1.25M/win is a good barometer.
  7. A caveat to the $1M/win benchmark; there are different standards for obtaining wins.   If you sign a $3M 1 year deal and then subsequently go 3-12 with a 6.00 ERA … while it looks like you reached the $1m/win threshold in reality you were, well, awful.  This analysis only really holds up for major FA contracts paying in excess of $10M/year.

Lastly, for comparison purposes, here’s the above analysis looks for the 2012 Nationals pitching staff.  Keep in mind that the $/win figures for pre-arbitration pitchers vastly skew the analysis.

Last Name First Name Total Value (includes club options) $/year AAV Starts QS Wins $ per QS $ AAV per win
Strasburg Steven $15,100,000 $3,775,000 45 28 21 $539,286 $719,048
Gonzalez Gio $42,000,000 $8,400,000 32 22 21 $381,818 $400,000
Zimmermann Jordan $2,300,000 $2,300,000 32 24 12 $95,833 $191,667
Jackson Edwin $11,000,000 $11,000,000 31 17 10 $647,059 $1,100,000
Wang Chien-Ming $4,000,000 $4,000,000 5 0 2 #DIV/0! $2,000,000
Detwiler Ross $485,000 $485,000 27 12 10 $40,417 $48,500
Lannan John $5,000,000 $5,000,000 6 2 4 $2,500,000 $1,250,000
Maya Yunesky $8,000,000 $2,000,000 10 1 1 $6,000,000 $6,000,000

The counting figures for Starts/QS/Wins/Losses are cumulative for the life of whatever contract the player is on.  So for Strasburg, he was basically in the 4th year of his original 4 year deal, hence the 45 total starts in those 4 years.  For guys like Zimmermann and Detwiler, the analysis is just for 2012 since they were playing on one-year deals.

The 2012 Nats have $AAV per win values all over the road:

  • Detwiler‘s $48k per win in 2012 is an amazing bargain; he got 10 wins while pitching for basically the MLB minimum.  And, Zimmermann‘s 12-win season while on a first-year Arbitration salary also represented about 20% of what those wins would have cost on the FA market.
  • Jackson produced almost exactly at the expectations for a FA starter; $11M contract, 10 wins, and $1.1M per win.  In 2013 if we get 12-13 wins from Dan Haren, we’ll be doing alright.
  • Lannan provided just on the borderline of bust production, as you’d expect for someone who got paid $5M to give the team 6 starts.
  • Wang: $4M salary, 5 starts, zero quality starts, 2 wins and a $2M/win price tag.  Yes; he was a bust.
  • Lastly Mr. Yunesky Maya.  The team has now paid him $6M over three years.  In that time he’s gotten 10 MLB starts and has produced exactly one Quality start and one win.  That’s $6M the team has paid for each win, in the range for one of the worst dollar-per-win contracts ever signed.  Of course, the Nats only signed him for $8M (not the $46M contract Igawa got), so the downside is limited.  But it does illustrated just how badly this deal has gone for the team.

Trevor Bauer video of pitch grips

2 comments

Pitching phenom Trevor Bauer demonstrates his pitching grips. Photo Kevin C. Cox/Getty Images via bleacherreport.com

Fascinating stuff here (link on youtube but referenced via the HardBallTalk blog).

I know I criticized Trevor Bauer in the wake of Arizona trading him away for what seemed to be personality issues.  But in hindsight, with the knowledge now that the team also traded Chris Young and now Justin Upton for apparently all the same reasons (manager Kirk Gibson didn’t like them, or didn’t like the way they played), at some point you have to start looking at the manager who can’t get along with star players versus the reverse.

But stuff like this video really makes me like the kid.  He posted this video showing how he grips and throws all his pitches in response to questions he got from regular fans.  He also freely gives out his facebook and twitter contact information and promises to try to get back to fans who ask questions.  I love social media sometimes.

Bauer’s pitch grips and thoughts:

  • Four Seam Fastball: conventional grip, nothing special.  He doesn’t mention throwing a 2-seam fastball other than mentioning the pitch in passing later on, but with his velocity and his throwing motion (straight over the top) you’d have to think a 2-seamer would be effective.
  • Regular Changeup: not a palm-ball, but a de-acceleration technique by throwing the ball off his middle fingers.
  • “Cut” Changeup; moves his index finger up and provides a bit of pressure; this apparently causes the ball to “cut” 2-3 inches.
  • Cutter; he calls it his “regular slider,” but its an odd grip for a slider; it looks more like a 2-seam fastball grip.  He admits it moves more like a cutter, so that’s what I’ve called it.  He seems to fix his wrist slightly askew, then go through a fastball motion and the ball cuts.
  • Slider: This is a much more conventional slider grip and throwing motion.  He calls it a “dot” slider (likely because the seams form a dot on the spinning baseball) and says that its rather “slurvy,” probably because (unlike his curve) it moves across his body.
  • Reverse Slider: He uses the same cutter grip but fixes his wrist in and then comes through the ball with a screw-ball motion.  He says he gets 4-6 inches of reverse movement.  Man that’s a lot of movement if its true.  Mariano Rivera only gets about 7-8″ of movement on what is generally the best cutter in the game.
  • Curve: he throws 2 variations depending on whether he’s looking to control it for strikes or to really break it off as an out pitch.  He varies the pressure of his middle finger; less on the tip for lesser movement/more control and then more on the tip for more movement/sharper break.  He doesn’t seem to snap his wrist in the same way that a 3/4 pitcher would (basically where the wrist snaps towards the opposite side of the body); he snaps his wrist straight down towards the ground.   This should result in close to a 12-to-6 curve that is relatively rare in the majors.  I would have thought this meant less spin, but I’d also guess that with enough wrist strength and repeitition,  you’d get the spin you need.
  • Split Fingered fastball: he definitely throws this like Roger Clemens or Mike Scott, where the ball isn’t jammed back into the hand like a forkball, but instead is more like a fastball brip with spread fingers.   He doesn’t throw this much, but it makes sense for an over-the-top guy to throw this.  (I often said that Brad Peacock needed to learn this same pitch).

He also talks a lot about the way he fixes his wrist on pitches (changeups and sliders) and brings his arm through.  I wonder; is that conventional?  I’ve never given thought to the position of my own wrist when I have pitched in the past.

So, that’s 8 specific pitches, perhaps 9 if you count a 2 seam fastball in there.  And there’s no circle change or knuckle curve.   How do you call a game with this guy?

His pitch f/x data is limited from 2012; they only have 169 pitches classified.  They have him throwing 4 differerent pitches (FB, CU, CH, SL) at speeds that generally are lower than his scouting reports have him throwing (FB average velocity 92.2 with a 95.1 max).  I’m hoping he gets a shot in 2013 to really show his repetoire.  I’d like to see what he can do in the majors.

Written by Todd Boss

January 31st, 2013 at 9:50 am

Verducci effect for 2013 announced

8 comments

Verducci predicts Nats fans may be reliving this ugly moment. Photo credit unknown.

SI sportswriter Tom Verducci published his 2013 iteration of the “Verducci Effect” article this week, and our own Stephen Strasburg is on his watch list.

The questions we’ll address in this article are these: Should we be worried as Nats fans about Strasburg?  And, do you even believe in the Verducci effect?

Cutting and pasting from his article, here’s the Verducci Effect defined (or the “Year-After Effect” as he calls it, so as humbly not to refer to the theory by his own name as the rest of us do):

The Year-After Effect, as I called the risk after a big innings jumps, is not a scientific, predictive system. It’s a rule of thumb to identify pitchers who may be at risk because of a sharp increase in workload. The older the pitcher, the bigger the body type and the closer to the 30-inning threshold is their increase, the less they seem to be at risk.

Of importance here is his own admission; this is a “rule of thumb,” not a scientific analysis, he limits his candidates to pitchers age 25 or younger, and he picks players instead of doing an across-the-board analysis of all eligible players (this is important as we talk about whether the effect is statistically supported).  He identified 14 such players in his 2012 iteration of this analysis and 9 of them suffered injuries or “significant regression.”  He has a similar track record in his previous years; of the 69 pitchers he’s identified in the last 7 years as being at risk, 55 of them have now suffered injury/posted significantly worse ERAs.  That’s about an 80% succeessful prediction clip.

Strasburg pitched 68 MLB innings and another 55 1/3 in the minors for a total of 123 1/3 2010 innings.  He threw 159 1/3 in 2012, for a total increase of 36 innings from his previous professional high, or a 22.6% increase.  Generally speaking Verducci’s threshold is in the 15-20% range.  Strasburg isn’t the most “at-risk” pitcher on the list; that would be Chicago’s Chris Sale, who amazingly threw 121 more innings in 2012 than he ever had before, being converted from the bullpen to a starter last year.   But Strasburg definitely increased his workload in 2012, and he’s likely to be increasing it again in 2013, with no stated limit on innings for the coming season.  If he averages the same number of innings per start this year as he did last year (5.69) he’ll end up with roughly 187 2/3 innings in 2013, which would be another 15% increase over his previous career high.  Most likely we’ll see him averaging closer to 6ip per outing, which would put him at about 200 innings and representing another 20% increase in innings.

Do we think this is dangerous territory?  Should we be worried?  All signs point to “No;” there’s not a person in the baseball world who would claim that the Nats have been anything but ultra-conservative with Strasburg since the moment he was signed.  His surgery, his recovery, and especially the heavily criticized “shut-down” in September of last year.  The team chose to be less competitive in the short term in order to attempt to be a better, stronger team in the long term.  Given his gradual ramping up of innings and his carefully managed recovery, I expect to see a similar season that Jordan Zimmermann just gave, two years removed from the same surgery.  No injuries, a strong season but with some evident fatigue at season’s end.


A better question may be this: does the Verducci effect actually exist?

This January 2012 Deadspin.com article pretty nicely summarizes all the criticisms associated with the effect.  A few more links are in this article at AmazingAvenue.  This study done by The Hardball Times that looked at ALL pitchers age 25 or younger, divided the pitchers into two groups (those who did and did not throw 30 more innings and thus usually qualify for Verducci analysis) and studied the results.    They found that the overall performance didn’t seem to be different between the two groups.

So, if the effect doesn’t exist, why does Verducci have an 80% prediction success rate?  If the statistical differences between the two groups are identical, then why isn’t Verducci’s prediction rate closer to 50%?

The answer lies in the following statement: Verducci’s articles don’t present themselves to be a macro statistical analysis, and they doesn’t approach the problem in the same way that statisticians do.  Instead, he finds candidates that qualify and then passes judgement based on his professional opinion about whether they’re a “watch candidate.”  Which I think is a perfectly fine way to do an analysis piece like this.  Of the 11 pitchers he selected this year, 4 are from 2012 playoff teams, another 2 are from teams in the ultra-competitive AL East, and 2 more experienced such extremely high jumps in innings that even a non-statistical observation would conclude they’re injury risks for 2013.  I don’t think this kind of analysis is unreasonable frankly.  He clearly “cherry picked” these candidates but for good reason; they were for the most part either severely driven or were pitching a lot of higher-than-average leverage innings for the bulk of the year, all the while throwing deeper into seasons than ever before.

Its a combination of statistics and opinion; most critics of the theory use 100% statistics to claim that the effect doesn’t exist.  But that’s the rub that I keep coming back to when talking about the use of statistics in baseball; human behavior (aka, baseball players) doesn’t operate on a spreadsheet, and statistics cannot and will not entirely predict all situations in the future.  You can’t just say that the effect doesn’t exist because you can’t prove it exists statistically.  In this case, there’s clearly an analysis/opinion portion of the effect that takes into consideration immeasurable factors that (in Verducci’s opinion) lead to more stress and a higher probability of injury.  Plus, Verducci admits that “body type” and age do factor into his opinion; meaning that a guy with a big body (and by inference he likely means that a bigger body that takes stress off the shoulder) is more likely to be able to weather a larger workload.  Roger Clemens versus Tim Lincecum.  I’d also assume he’s looking at mechanics along the way (and Verducci is on record for being critical of Strasburg’s mechanics, as I discussed in this March 2011 post).  Statistics can’t measure mechanics, or body type, clearly portions of Verducci’s analysis.

Let me put it a different way: would anyone be the slightest bit surprised to see Sale come down with a shoulder injury in 2013?  I certainly would not.  And that’s the essence of the article, to provide a baseball opinion, and one of the reasons I still put stock into it while others waste time trying to disprove it.

Lets just hope Strasburg is one of the 20% he’s wrong about…

Written by Todd Boss

January 25th, 2013 at 10:56 am