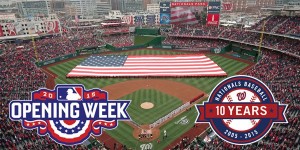
2015 opening day image via sayhellobaseball.wordpress.com
My recurring “Opening Day” trivia/useless information post. Here was 2015’s version, 2014‘s and 2013. Many of the below links are to Google XLS docs that i’ve updated for 2016 and which are available on the right hand side under “NatsArm Creations.”
Nats 2016 Opening day Payroll: $145,178,886 according to Cots. This is down nearly $20M from last year’s figure. We can only hope that Mike Rizzo will be allowed to “spend” that money later in the year at the trade deadline if this team actually needs to spend money to acquire helpful players.
My personal payroll estimate came in at $ $137,286,029 coincidentally; why am I $8M off? Because Cots basically makes arbitrary proclamations of salary for current year when money is deferred whereas I’m counting it as real dollars. So for example I’m charging the Nats payroll precisely $15M for Max Scherzer this year while Cots puts the figure north of $22M, and Cots puts all of Papelbon’s $3M deferred 2016 salary on the 2016 books. So between those two players the entire delta is accounted for.
The question is this: as a Nats fan are you “happy” that your payroll is down nearly $20M in Stephen Strasburg‘s walk year and while your Season Ticket prices continue to rise?
Opening Day Payroll; MLB
USAToday also publishes opening day salaries for teams and i’m convinced that they’re garbage. I’ve got a comparison spreadsheet where i’ve put the USAtoday figures side-by-side with Cots’ analysis and for some teams they’re off by more than $25M. The problem is that USAToday doesn’t count ANY payments handed to and from between teams, whereas Cots does a very detailed auditing of such money.
Nonetheless, here’s USAToday and Cots’ rankings for the 30 teams (this is my first time using this new Table plug in; head to Google XLS to read it if this is too difficult):
Opening day Nats park attendance
Opening Day 2016 attendance was announced at 41,650. That’s down more than 800 from last year (but still a sell-out). Perhaps the rain forcast kept people away. Here’s all our home openers in order with attendance, time of game, weather:
- 2016: 41,650 (4:05 thursday game, 60 and 1.5hr rain delay)
- 2015: 42,295 (4:05 monday game, 75 and gorgeous)
- 2014: 42,834 (1:05 friday game, 50s and overcast)
- 2013: 45,274 (1:05 monday game, 60 and beautiful)
- 2012: 40,907 (1:05 thursday game 56, partly cloudy)
- 2011: 39,055 (1:05 thursday game, 41 degrees and overcast)
- 2010: 41,290 (1pm game monday, beautiful weather 80s and sunny): Phillies invasion
- 2009: 40,386 (3pm game on a monday, chilly 53degr and overcast)
- 2008: 39,389 (season and stadium opener), 8pm sunday night, Braves, nat’l tv clear but cold.
- 2007: 40,389 (in rfk, 1pm game vs Florida, 72degrees
- 2006: 40,516 (in rfk, tuesday day game vs Mets, 72degr and sunny)
- 2005: 45,596 (in rfk, debut of entire franchise, 62degr and clear, evening game).
Here’s some attendance milestones for the franchise:
- Nats park capacity for 2015 seems to still be 41,456 unless they announce an 2016 adjustment.
- 2015’s opening day crowd wasn’t even close to 2013’s: 45,274. That remains the regular season record attendance.
- All time record attendance? The ill-fated 2012 NLDS game 5: 45,966.
- The first game in franchise history; 2005 in RFK: 45,596, which stood until the NLDS record-setting game.
- The long-running regular season attendance record was the great Fathers day 2006 game in RFK against the Yankees: 45,157. That record stood for more than 6 years.
Opening Day Box Scores and Results
Nats are just 4-8 in their home openers now since moving to Washington. Just one guy has thrown more than one home opener for the Nats: Livan Hernandez. When Livan gets elected to Cooperstown, I hope he’s wearing the curly W. 
- 2016: mlb.com: Marlins d Nats 6-4. WP: David Phelps, LP Tanner Roark (Starters: Brian Conley and Roark).
- 2015: mlb.com: Mets d Nats 3-1. WP: Bartolo Colon. LP: Max Scherzer
- 2014: mlb.com or b-r.com. Braves d Nats 2-1. WP: Luis Avilan. LP: Tyler Clippard. (Starters: Jordan Zimmermann and David Hale).
- 2013: mlb.com or b-r.com. Nats d Marlins 2-0. WP: Stephen Strasburg. LP: Ricky Nolasco
- 2012: mlb.com. Nats d Reds 3-2. WP: Craig Stammen. LP: Alfredo Simon (Starters: Gio Gonzalez and Mat Latos)
- 2011: mlb.com. Braves d Nats 2-0. WP: Derek Lowe. LP: Livan Hernandez
- 2010: mlb.com. Phillies d Nats 11-1. WP: Roy Halladay. LP: John Lannan
- 2009: mlb.com. Phillies d Nats 9-8. WP: Jamie Moyer. LP: Saul Rivera (Nats Starter: Daniel Cabrera)
- 2008: mlb.com. Nats d Braves 3-2. WP: Jon Rauch. LP: Peter Moylan (Starters: Tim Hudson and Odalis Perez)
- 2007: mlb.com. Marlins d Nats 9-2. WP: Dontrelle Willis. LP: John Patterson
- 2006: mlb.com. Mets d Nats 7-1. WP: Brian Bannister. LP: Ramon Ortiz
- 2005: mlb.com. Nats beat Arizona 5-3. WP: Livan Hernandez. LP: Javier Vazquez
How about Season openers?
Record: 5-7. # times home/away: 6 home, 6 away.
The Nats managed to lose 6 of their first 7 season openers … only winning in 2008 when debuting their new stadium. And Jon Rauch did his darndest to blow that opener too, coughing up the lead in the 9th to give Ryan Zimmerman a chance at glory.
2016: away: Nats d Braves 4-3. WP Treinen, LP O’Flarity (starters Scherzer, Teheran)
2015: home: Mets d Nats 3-1. WP: Bartolo Colon. LP: Max Scherzer
2014: away: Nats d Mets 9-7. WP Aaron Barrett, LP Familia (starters Strasburg, Dillon Gee)
2013: home: Nats d Marlins 2-0. WP: Stephen Strasburg. LP: Ricky Nolasco
2012: away: Nats d Cubs 2-1. WP Clippard, LP Marmol (starters: Strasburg and Ryan Dempster)
2011: home: Braves d Nats 2-0. WP: Derek Lowe. LP: Livan Hernandez
2010: home: Phillies d Nats 11-1. WP: Roy Halladay. LP: John Lannan
2009: away: Marlins d Nats 12-6. WP: Nolasco, LP; Lannan
2008: home: Nats d Braves 3-2. WP: Jon Rauch. LP: Peter Moylan (Starters: Tim Hudson and Odalis Perez)
2007: home: Marlins d Nats 9-2. WP: Dontrelle Willis. LP: John Patterson
2006: away: Mets d Nats 3-2. WP: Glavine, LP: Hernandez
2005: away: Phillies d Nats 8-4. WP: Lieber, LP: Hernandez
Opening Day Starter Trivia
Here’s my Opening Day starters worksheet in Google docs. Here’s the answer to some fun Opening Day Starter trivia:
- Leader in Opening day starts: remains C.C. Sabathia with 11, though he’s missed the last two years.
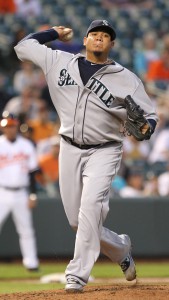
- Leader in consecutive opening day starts: Felix Hernandez, making his 8th consecutive, 9th overall.
- Justin Verlander returned to Opening Day duties, getting his 8th career opening day start; he remains in 3rd place actively.
- For the Nats; Max Scherzer gets his 2nd and Stephen Strasburg continues to have three.
- Ten (10) pitchers made their first opening day start in 2016.
- There’s 8 guys out there still active with 4 or more Opening Day starts who did not get them this year, and they include a number of former Aces who might be on the way out of the game (Tim Lincecum in particular, but also guys like James Shields, Bartolo Colon and Yovanni Gallardo)
- The most ever? Tom Seaver with 16. The most consecutive? Jack Morris with 14.


