Nationals Arm Race

"… the reason you win or lose is darn near always the same – pitching.” — Earl Weaver

Archive for April, 2013

Ladson’s Inbox 4/8/13

leave a comment

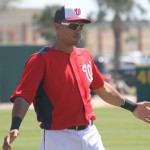
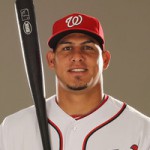
Ramos has started hot; how long will he platoon w/ Suzuki? Photo Al Bello/Getty Images via federalbaseball.com

One week down, one serious over-reaction to a series loss against  Cincinnati, and we have our next installment of Bill Ladson‘s inbox, dated 4/8/13.  Lets see what Nats fans have on their mind this early in the season.  Hopefully it isn’t “they sky is falling” because we lost 2 of 3 to a very good Cincinnati team.

As always, I answer here before reading his response and sometimes edit “questions” for clarity/levity.

Q: Even though catchers Wilson Ramos and Kurt Suzuki are in the lineup every other day, it seems to me like Gio Gonzalez’s personal catcher is Suzuki. Does that play into Johnson’s decision making?

A: Is Kurt Suzuki Gio Gonzalez‘s personal catcher?  I never noted that.  Gonzalez was caught by every catcher on the roster last year but had Suzuki 10 times.  Based on when Suzuki came over, that seems an awful lot.  But last night 4/9/13 Gonzalez was caught by Ramos.  So who knows.  If Gonzalez has asked for Suzuki to be his catcher, then yes absolutely this factors into lineup decisions.  Luckily both Suzuki and Wilson Ramos are right handers, so there’s no matchup considerations right now.

Coincidentally, I was really surprised to see Ramos sit the day after he hit two bombs over the weekend.  I know Suzuki is the vet, Ramos is theoretically on the mend and they’ve said they’re splitting time … but I want my hot bats in the lineup, not sitting on the bench because of some even-odd playing time split that’s been promised.

Ladson doesn’t think there’s a personal catcher situation going on.

Q: Is Johnson letting Harper’s throwing mistakes slide?

A: I doubt it.  But i’m glad its being handled in private and not in the press.  Ironically the Sports Junkies asked Johnson about this very topic this morning 4/10/13 and Johnson definitely seemed to indicate that he believes Harper is just over-excited, needs to keep his game emotions in control, and that the coaching staff is constantly talking to him to fix mental errors like these.   Ladson doesn’t think Johnson is letting it slide either but says we’ll have to see “how it goes.”

Q: If one of the current five starters goes down with an injury, who will get the callup to start for the Nationals?

A: A week ago I would have said Zach Duke, but he looked pretty awful in his one appearance so far.  I would bet that if someone went down tomorrow the team would call up Ross Ohlendorf.  But in a couple of weeks time the #1 replacement would have to be Chris Young.   Ladson says Young.

Q: Do you see the Nats releasing reliever Henry Rodriguez if he is ineffective after a month or so?

A: I don’t think they’ll release him; i’m sure they’d try to DFA him and sneak him through waivers to AAA so they could keep him.  Mike Rizzo loves his arm.  But he’s been short on results and long on frustration for a lot of his tenure here.  Every once in a while you see players who the manager/GM just won’t give up on despite results (Austin Kearns and Manny Acta/Jim Bowden being one good example); I wonder if we’re getting to that point with H-Rod.   Ladson says no way.

Q: After 2013, would general manager Mike Rizzo consider Jayson Werth as a player-manager?

A: No way.  Werth needs to focus on hitting and not being a player manager.   The team will get a professional manager to guide the team going forward.  Ladsons says Werth may be a Team Captain but never the manager.  He also names Joe Girardi as his guess for the next manager.  Interesting.

Q: What plans do the Nats have when it comes to incorporating the designated hitter into their roster this season? Would they consider having Anthony Rendon added to the roster and DHing Ryan Zimmerman?

A: Interesting question.  I’d guess that initially they’d go with a platoon DH split of Tyler Moore and Chad Tracy for any interleague games in the AL park.  Rendon is staying in the minors until needed to keep his service time down.  Ladson writes almost exactly what I wrote.

Would you rather have Houston or Durham’s rotation?

6 comments

My Pitching Rotation Rankings post (published on January 7th 2013)  ended up with poor Houston ranked as the 30th best rotation heading into the 2013 season.  They’re heading into the 2013 season with this rotation of guys:

Rank Name Age 2012 Stats
1 Bud Norris 28 (MLB Hou) 7-13, 4.65 ERA, 1.37 whip, 86 ERA+, 4.23 fip
2 Lucas Harrell 28 (MLB Hou) 11-11, 3.76 ERA, 1.36 whip, 106 ERA+, 3.75 fip
3 Philip Humbel 30 (MLB CWS) 5-5 6.44 ERA, 1.54 whip, 68 ERA+, 5.77 fip
4 Erik Bedard 34 (MLB Pit) 7-14, 5.01 ERA, 1.47 whip, 74 ERA+, 4.07 fip
5 Brad Peacock 25 (AAA Sac) 12-9, 6.01 ERA, 1.58 whip, 4.26 fip

There’s a couple of decent possibilities here: Norris looked pretty good opening day and Harrell’s numbers last year weren’t bad.  The other three though?  Phew.  Even Nats favorite Brad Peacock isn’t that convincing right now as a starter, based on his numbers in the PCL last year.

Now, here’s Tampa Bay AAA affiliate Durham Bull’s opening day 2013 rotation:

Rank Name Age 2012 Stats
1 Chris Archer 24 (AAA Dur): 7-9, 3.66 era, 1.258 whip, 3.25 fip
2 Jake Odorizzi 23 (AAA Oma): 11-3, 2.93 era, 1.35 whip, 4.19 fip
3 Alex Colome 25 (AA Birm) 8-3, 3.48 ERA, 1.37 whip, 2.91 fip
4 Mike Montgomery 23 (AAA Oma): 3-6, 5.89 ERA, 1.67 whip, 4.95 fip
5 Alex Torres 25 (AAA Dur): 3-7, 7-30 era, 1.93 whip, 4.56 fip

Tampa’s AAA rotation includes Keith Law‘s #53, #68 and #81 top prospects for 2013 in Archer, Odorizzi and Colome respectively.  Montgomery was Kansas City’s #1 prospect for quite a while and has struggled in AAA, but he reached AAA as a 21 year old in 2011.  Torres may switch places with a 6-year ML FA signing (the Bulls do have former Nat favorite J.D. Martin on their roster among other candidates) but the strength of this group is the first four guys.

Given that Tampa is notoriously slow in bringing along its starting pitcher prospects, its safe to assume that most of these guys would have already matriculated to lesser team’s rotations (of them only Archer has MLB service time; he got 4 starts and 30 innings late last year).   As it stands now, none of them can crack Tampa’s MLB rotation of David Price, Matt Moore, Jeremy Hellickson, Alex Cobb and Roberto Hernandez.  And this is all AFTER the big Tampa-KC trade which sent two other starters (James Shields and Wade Davis) to Kansas City.  And this doesn’t include former rotation stalwart Jeff Niemann, who just had season ending shoulder surgery. Man that’s a lot of starting pitching depth.

(Side note: Roberto Hernandez is officially “Roberto (Heredia) Hernandez,” the artist formerly known as Fausto Carmona.  He is also the first Free Agent to start a game for Tampa Bay since 2005!  Just an amazing statistic frankly, and an amazing tribute to Tampa’s pitching development staff).

So, honestly, which of these starting 5 would you want right now?  Not on potential, but on the ability to get major league hitters out in 2013?

Non-Baseball post: NCAA Tourney Trivia

one comment

Despite not really being a big NCAA basketball fan, I’m as intrigued as the next guy about the tournament, 12-vs-5 seed match-ups, and other statistical oddities.  This year, with the alma-mater James Madison University making the tournament for the first time since 1994, I took a slightly increased interest in the tournament.  And each year it seems we add to the lists of amazing accomplishments when it comes to upsets (2013’s list is high lighted below in red), mid-majors making the final four, or top teams getting eliminated early.

Here’s some useless trivia on the tournament, collected over the years, updated for 2013’s tournamnet.

NCAA tourney Trivia

Seeding began in 1979, field expands to 64 in 1985 (I’m conveniently ignoring the “expansion” to 68)

Lowest seeds to make final four (since seeding began in 1979)
– #11: LSU 1986, #11 George Mason 2006, #11 VCU 2011
– #9: Penn 1979, Wichita State 2013
– #8: UCLA 1980, Villanova 1985, Wisconsin 2000, UNC 2000, Butler 2011
– #7: Virginia 1984
– #6: Michigan 1992, Kansas 1988, Providence 1987,Nc State 1983, Houston 1982, Purdue 1980
– #5: Florida 2000, Iowa 1980, Indiana 2002

Interesting that no #12 seed, despite 12/5 upsets every year, has made the final four.  Clearly its easier to make it out of a bracket from the #11 seed spot, who has to beat #6, #3, #2 and #1 seeds of a region in order, hence getting the #1 seed last.

Lowest seeds to win it/Non #1 or #2 seeds to win it
– #8: Villanova 1985
– #6: Nc State 1983
– #6: Kansas 1988
– #4: Arizona 1997
– #3: Michigan 1989
– #3: Syracuse 2003
– #3: Florida 2006
– #3: UConn 2011

Villanova and Nc State’s runs are among the two best tournament stories in history of course.

#1 Seeds that have lost in 2nd Round: Happened 15 times since expansion to 64 teams in 85

– 1985: #8 Villanova d #1 Michigan (Villanova wins tourney)
– 1986: #8 Auburn d #1 St. Johns (Auburn loses regional final)
– 1990: #8 UNC d #1 Oklahoma (UNC loses next round)
– 1992: #9 UTEP d #1 Kansas (UTEP loses next round)
– 1994: #9 BC d #1 UNC (BC loses next round)
– 1996: #8 Georgia d #1 Purdue (loses next round)
– 1998: #8 Rhode Island d #1 Kansas (loses regional final)
– 2000: #8 UNC d #1 Stanford (loses final four)
– 2000: #8 Wisconsin d #1 Arizona (loses in final four)
– 2002: #8 UCLA d #1 Cincinnati (loses next round)
– 2004: #9 UAB d #1 Kentucky (loses next round)
– 2004: #8 Alabama d #1 Stanford (loses reg. final)
– 2010: #9 Northern Iowa d #1 Kansas (lost next round)
– 2011: #8 Butler d #1 Pittsburgh (lost in national final)
– 2013: #9 Wichita State d #1 Gonzaga (lost in the final four)

I have a theory about college basketball in general, and it is sort of highlighted by the Butler and Wichita State results here.  And to a lesser extent VCU’s run a few years ago.  The theory is this; with fewer top guys staying all four years, the mid-major teams who recruit a nucleaus of guys who play together for four years end up being nearly as good a team as a team of high-end recruits who are freshman or sophomores.  Hence why we’re clearly seeing more mid-major teams working their way through to the later stages of the game.  Anyone who calls VCU a cinderella didn’t watch their games; they pounded teams, good teams, ranked teams on their way to the final four.  They were no fluke.  I talked about this in a March 2011 post with more details.  Wichita State this year was a very, very good team.  Butler nearly won the national title two years ago.

Why don’t these teams get more national press?  Because national writers just assume that because a team plays in the ACC or Big East, they’re better.  So we’ll continue to see these “upsets” until eventually we get more national parity in terms of press coverage.

Closest call 1-16 games
– 1985: Michigan d Farleigh Dickenson 59-55
– 1989: Georgetown d Princeton 50-49
– 1989: Oklahoma d East Tennessee State 72-71
– 1990: Michigan State d Murray State 75-71 OT
– 1996: Purdue d Western Carolina 73-71
– 2006: Connecticut d Albany 72-59 (Uconn down by 12 in 2nd half)
– 2013: Gonzaga d Southern 64-58 (tied later in the game)

I didn’t really think the Gonzaga/Southern game was *that* close … but everyone talked about how they “got a scare.”  This was no one-point win or OT win, like we saw before.  I remember watching the Georgetown-Princeton game; Princeton had a shot at the end to win it and the shooter was *clearly* fouled … but no call and Georgetown escaped.

Side note: why does Georgetown constantly have issues with these long-shot seeds?

#15 seeds that have won games (7): only FGCU has advanced.
– 1991 Richmond over Syracuse
– 1993 Santa Clara over Arizona
– 1997 Coppin State over South Carolina (then lost to Texas by 1 2nd rnd)
– 2001: Hampton over Iowa State
– 2012: Norfolk State over Missouri
– 2012: Lehigh over Duke
– 2013: Florida Gulf Coast over Georgetown (then won easily in 2nd round over SDSU, lost by 10 in sweet 16)

FGCU was no fluke; they cruised to wins over both Georgetown and San Diego State, and jumped way ahead of Florida in the sweet 16 before sound coaching from Billy Donovan took over and Florida was able to grind them down.  If FGCU had just one half-way decent rebounder I think they would have beaten Florida.

#13,14 seeds that have made it to the sweet 16 (6) (none made it beyond)
– #14 Cleveland State 1986 (then lost 71-70 to #7 Navy)
– #13 Richmond 1988 (blown out by #1 temple)
– #14 Tennessee-Chattanooga 1997 (Loses 71-65 Providence)
– #13 Valparaiso 1998 (Loses to #8 Rhode Island)
– #13 Oklahoma 1999
– #13 Ohio 2011

Mid-Majors to make Elite 8 since 1985 (expansion to 64).  11 times now.
– 1981: #6 Wichita State (MVC)
– 1986: #7 Navy (CAA); David Robertson
– 1990: #11 Loyola Marymount (WCC): Hank Gathers & Bo Kimble
– 1999: #10 Gonzaga (WCC)
– 2002: #10 Kent State (MAC)
– 2006: #11 George Mason (CAA)
– 2008: #10 Davidson (Southern): had Stephan Curry
– 2010: #5 Butler (Horizon)
– 2011: #8 Butler (Horizon)
– 2011: #11 VCU (CAA)
– 2013: #9 Wichita State (MVC)

“High-Mid” majors to elite 8 since 79 (Louisville in Metro/C-USA a number of times here)
– 1980,2,3,6: Louisville
– 1981: #6 BYU (MWC)
– 1984: #10 Dayton (A10)
– 1987-1991: #1, #4 UNLV (MWC)
– 1996: #1 UMass (A10)
– 1997: #3 Utah (MWC), Louisville (Cusa)
– 2001: #11 Temple (A10)
– 2004: #1 St. Josephs, #7 Xavier (A10)
– 2005: Louisville (cusa)
– 2007: #2 Memphis (C-usa)
– 2008: #1 Memphis (c-usa), #3 Xavier (A10)

Unlike other pundits, who divide the basketball conferences into “big 6” and “mid-major,” I think there’s a third tier.  The big 6 conferences are obvious (Big East, ACC, SEC, Big10, Big12 and Pac10).  But basketball conferences like the old Metro Conference, Conference-USA, the Atlantic-10 and to a slightly lesser extent the Mountain West Conference have in many cases been just as strong as the big-6 conferences.  They’ve had #1 ranked teams, plenty of #1 overall teams (just see the list above), and i think a distinction between “mid-majors” and these “high” mid-majors should be made.

Mid/High mid-Majors to make final four: (Not counting Louisville pre-Big East here)
– 1979: #1 Indiana State (MVC), #9 Pennsylvania (Ivy)
– 1987, 1990, 1991: #1 UNLV (MWC)
– 1997: #3 Utah (MWC)
– 2006: #11 George Mason (CAA)
– 2010: #5 Butler (Horizon)
– 2011: #8 Butler (Horizon), #11 VCU (CAA)
– 2013: #9 Wichita State (MVC)

Years no #1 seeds didn’t make final 4
– 1980: #5 Iowa, #2 Louisville, #6 Purdue, #8 Ucla
– 2006: #4 LSU, #2 Ucla, #11 George Mason, #3 Florida
– 2011: #8 Butler, #11 VCU, #3 Uconn, #4 Kentucky

Teams to beat three #1 seeds in a tourney
– 1997; #4 Arizona

Conferences that have never won an NCAA game: Patriot


Only team from a “power” conference never to make the NCAA tournament?:  Northwestern

Biggest margin of victory in Final game
– 1990: UNLV over Duke 103-73
– 1992: Duke d Mich State 71-51

Highest combined seed count of any final four?
– 2000: 22 (Mich St 1, Florida 5, UNC 8, Wisc 8)
– 2011: 26 (Butler 8, VCU 11, Uconn 3, Kentucky 4)

Lowest:
– 1999, 1997: 7: 3 ones and a 4
– 1993: 5 (3 ones and a two)
– 2008: 4: all four #1 seeds made the final4

Teams to win NCAA title, finishing undefeated
– None since 1979 (when seeding started in the tourney)
– 1954: Kentucky (but barred form post-season for ineligible players)
– 1956: San Francisco
– 1957: UNC
– 1964: UCLA
– 1967: UCLA
– 1972: UCLA
– 1973: UCLA
– 1973: NC State (barred from post-season recruiting violations)
– 1976: Indiana (just voted best ever NCAA team)

Teams to enter Tourney Undefeated, but lose
– 1979: Indiana State: Lost in final to Michigan (Larry Bird’s team)
– 1991: UNLV: lost to Duke in National semis

Lowest Seeding ever given to a power6 conference team?
– 2008: Georga was a #13 seed
– 1999: #13 Oklahoma 1999

– 2013: Oregon, Cal and Ole Miss all given #12 seeds from power conferences.
Written by Todd Boss

April 9th, 2013 at 9:13 am

Does Andrus’ new contract really affect Desmond?

2 comments

Is Desmond really a 9-figure contract waiting to happen?? Photo Drew Kinback/Natsnq.com

A few days ago Elvis Andrus signed an 8yr/$120M contract with Texas that had some heads shaking in the industry.   Here locally, the immediate focus was on our own pre-free agency shortstop Ian Desmond and what his future FA value may be in light of this monster deal.

Sidenote: I just don’t get the Andrus contract.  You mean to tell me you can’t find another shortstop in the minors who can field nearly as well as Andrus and hit 15% below MLB replacement level (his career OPS+ is 84)?  Or at least find one who you can get away with paying just a couple million dollars a year at best.   What am I missing in Andrus that makes him worth this kind of money?  Is it all about his defense?  Meanwhile Texas has one of the best prospects in all of baseball (Jurickson Profar) in the minors featuring as a middle-infielder who could have naturally replaced Andrus at short … instead they’ll waste his talents at 2nd base and likely move Ian Kinsler to the outfield at some point in the future.  Dumb.

Does the Andrus contract really affect Desmond’s value?  So it may, according to The Washington TimesAmanda Comak.  MLBtraderumors weighed in on the topic as well, claiming that Andrus “may not have as much pop” as Desmond but is clearly better defensively, and has been consistently “good” for four years.

Is that all really true?  Is Andrus really that much better of a player than Desmond?  Lets take a quick peek at some value, hitting and defensive stats for both players.  I’m using 2009-12 for Andrus (all full seasons) and just 2010-12 for Desmond (again, just using full seasons for comparison purposes):

Andrus OPS+ Andrus bWAR Andrus fWAR Andrus uzr/150
2009 82 3.6 3.1 13.3
2010 72 1.4 2 1.8
2011 89 4.1 4.1 7.5
2012 91 3.7 3.9 8.5
Desmond OPS+ Desmond bWAR Desmond fWAR Desmond uzr/150
2010 89 1.1 0.9 -9.2
2011 80 1.5 1.2 -4.5
2012 126 3.4 5 6

Using just the full seasons, we can see that Andrus has always been a weak hitter; even when Nats fans were burning Desmond in effigy for being such a bad hitter in 2011, he was still for the most part as good as Andrus ever was.  And that was before 2012 when Desmond broke out and hit like a middle-of-the-order guy.

How about Defensively?  Andrus’ career numbers at short show a very good defender while Desmond shows a defender on the improvement, nearly matching Andrus’ UZR/150 rating in 2012.  Is Desmond THAT much behind Andrus defensively at this point?

How about Value?  Note i’ve put in both WAR figures because this is one of those examples where I cannot defend baseball-reference’s war calculations; how does Andrus have a BETTER 2012 WAR than Desmond given that they’re nearly identical in defensive metrics but Desmond vastly outhit Andrus?  Fangraph’s war does show this accurately, putting Desmond’s war at 5.0 to Andrus’ 3.9.

Yes I get that Andrus has now performed ably for 4 straight seasons while Desmond has been exceptional for only one.  Is that a $100 million dollar difference?   But ask yourself this question; if Desmond hits at a 110-120 OPS+ clip for the next two years AND continues to be a positive UZR/150 defender … is he a 9-figure player?  I guess so in today’s market.

Written by Todd Boss

April 8th, 2013 at 10:00 am

This is why they play 162…

5 comments

Haren's first Nats outing wasn't much better than his spotty Spring Training. Photo nats official via espn.com

Dan Haren‘s debut with the Nats couldn’t have gone much worse, as he gave up 6 runs in 4 innings to help contribute to an ugly score line as the Nats lost 15-0 friday night in Cincinnati.

Haren’s troubles were simple; he did not hit his spots and left balls out over the plate.  Each of the four homers he gave up were center cut 90mph meat-balls that missed the outside corner he was aiming for (and that Kurt Suzuki was asking for) by 6-8 inches.  Professional hitters are going to punish these mistakes, and when you play in a bandbox as Cincinnati does, line drives to left field turn into homers instead of doubles off the wall.

I turned the game off when Zach Duke let in the 7th run; he proceeded to show why he was available on a minor league deal last off-season.  Hopefully subsequent appearances will continue to be of the mop-up variety where we don’t really care what the score line looks like, because that’s about what I’d expect of Duke after seeing last night’s performance.

Haren’s pitch f/x data isn’t encouraging; max of 90.7mph on his fastball, but he only broached 90 a handful of times, losing his max velocity as the night went on and barely hitting 88 by the time he was done.  Was he going to different pitches (cutters?)  I liked his split-fingered fastball on the night but he threw mostly fastballs and cutters (according to pitch f/x analysis anyway; i’m not sure how they tell the difference).

Written by Todd Boss

April 6th, 2013 at 11:56 am

Posted in Majors Pitching

Tagged with ,

MLB 2013 Predictions

8 comments

Opening day has past and I forgot to post the obligatory “predictions” piece for 2013.  Here’s some far-too-early predictions on who makes the playoffs this year.  For comparison purposes. here’s the Si.com Writer’s slate of predictions, with lots of success predicted for our Nats.  My predictions below look awfully similar to Si.com’s Baseball Preview standings too.

(For a trip down memory lane, here’s a link to my 2012 seasonal predictions, and as you may have guessed, I was way off).

  • AL East: Tampa Bay
  • AL Central: Detroit
  • AL West: Los Angeles Angels
  • AL Wild Cards: Toronto, Oakland

AL East Narrative: The year the Yankees died; they’re too old, too dependent on aging arms and aging bats, and did next to nothing to improve in the off-season (though they did just pick up Vernon Wells, the Angels’ 4th outfielder.  Great!)  For a team that makes hundreds of millions of dollars of profits a year from the stadium and their TV station, they seem awfully worried about a few million dollars of luxury tax.  (see *ahem* Los Angeles Dodgers *cough*).  I think Baltimore regresses back to the .500 team they should have been in 2012 (they too failed to appreciably improve their playoff team), and Boston seems stuck in some weird middle-ground for the time being.  Toronto seems greatly improved but falls slightly short of the champ.  Tampa is left standing in the AL East; they won’t miss James Shields that much with their amazing pitching depth and can call up the next version of Trout/Harper in Wil Myers in mid June.

In the AL Central, Kansas City’s short sighted trade will net them a .500 record, but isn’t nearly enough to catch the Tigers, who return their whole rotation, get back Victor Martinez and add a possibly underrated Torii Hunter to add to their formidable lineup.  How they only won 88 games last year still amazes me.  The White Sox could challenge, but what have they really done this off-season either?   On the bright side, all these teams get to feast on Cleveland and Minnesota, both of whom look to lose 90+ games.

In the AL West, the Angels (who had the best record in baseball post Trout-callup) continue where they left off and bash their way to a 90 win divisional title despite serious questions in the rotation.  Texas hasn’t replaced what they lost in the last two off-seasons in terms of either hitting (Josh Hamilton) or pitching (C.J. Wilson, Ryan Dempster, or Colby Lewis)  but should still compete for the 2nd wild card.  But, absent signing Kyle Lohse (too late; he went to Milwaukee) or doing something to augment their starting pitching, I see trouble in the back of their rotation.  Meanwhile, Seattle made one curious move after another this off-season, all to finish in 4th place.  And Houston will challenge the 1962 Mets for futility, to the benefit of the entire division.

Wild Cards: Toronto has bought themselves a playoff team with their wholesale purchase of half the Marlins team.  However, I wouldn’t be surprised to see both WCs come out of the AL west, who get to feast on two pretty bad teams.  For the time being i’ll predict that Oakland and Texas duke it out to the wire, with Oakland pipping them for yet another surprise playoff appearance.  Oakland won the division last year; who would doubt them again this year with a very young pitching staff having one additional year of experience?  I think it comes at the expense of Texas this year instead of the Angels.

How about the NL?

  • NL East: Washington
  • NL Central: Cincinnati
  • NL West: San Francisco
  • NL Wild Cards: Atlanta, St. Louis

NL East Narrative: Despite some people thinking that Atlanta has done enough to get by the Nats, I don’t quite see it.  The Upton brothers are high on potential but so far relatively low in actual production except in fits and spurts.   Philadelphia can make a decent run up to perhaps 88 wins … but it won’t be enough, and reports of Roy Halladay‘s declining velocity are more than troubling.  Meanwhile the Marlins are going to be historically bad; in the past when they’ve done sell-offs they had marquee crops of rookies to rise up.  Not this time; their farm system is decimated and they didn’t really get back the A-1 prospects of all their salary dumps that they should have.  The only way the Nats don’t cruise to a title would be significant injuries in the rotation, for which they have little insurance.

In the NL Central, St. Louis’ loss of Chris Carpenter may be just enough to knock them out of the divisional race, where Cincinnati looks like the most complete team outside of the Nats in all of baseball.   Pittsburgh is a couple years (and a couple of pitching aces in Jamison Taillon and Gerrit Cole) away from really competing, the Cubs are content losing 95 games, and Milwaukee still looks like the same team that barely was .500 last year (even given the Kyle Lohse signing).

In the NL West; who would bet against the Giants at this point?   Despite the ridiculous payroll, I don’t think the Dodgers are really that good and they’re hoarding starting pitchers for too few spots (though, looking at the Spring Training performance of some of these guys … they’ll likely not fetch what the Dodgers need).  Arizona keeps trading away its best players to get marginal prospects who happen to fit Kirk Gibson‘s mold of a “gritty player” … and they seem to be set to be a 3rd place team again.  Colorado and San Diego seem to be in various states of disarray, again.

Wild Cards: Atlanta may be a 96 win wild card.  Meanwhile, despite losing Carpenter the Cardinals can slot in any one of a number of high-powered arms to replace him in the rotation and continue to draw from what is now the consensus best farm system in the majors.  They’ll sneak into the wild card much as they did last year and commence bashing their way through the playoffs.

AL Playoff predictions:

  • WC play-in: Toronto beats out Oakland, whose youngsters will be completely baffled in a one-game playoff versus R.A. Dickey.
  • Divisionals: Toronto beats intra-divisional rival Tampa Bay, while Detroit takes advantage of a weakened Los Angeles rotation and takes a close series.
  • ALCS: Detroit outlasts Toronto in the ALCS on the strenght of its starting pitching.

NL Playoff predictions

  • WC play-in: Atlanta beats St. Louis in the play-in by NOT allowing an infield-fly pop up to fall in this year.
  • Divisionals: Washington outlasts Atlanta in one brutal divisional series, Cincinnati gets revenge on San Francisco in the other.
  • NLCS: Washington over Cincinnati; they’re just slightly better on both sides of the ball.

World Series: Washington’s proclivities to strike out come back to haunt them as the Tigers excellent starting pitchers dominate.   Can’t be too confident in our Nats; i’d love to be wrong and send out Davey Johnson a winner.

Awards: this is just folly to do pre-season awards picks but here’s a quick run through without much commentary:

  • AL MVP: Mike Trout gets the award he should have won last year
  • AL Cy Young: Justin Verlander as he wins 24 games in the weak AL Central
  • AL Rookie; Wil Myers, who rakes once he gets called up in June
  • AL Manager: Joe Madden, who guides Tampa to the best record in the AL.
  • NL MVP: Joey Votto, though I wouldn’t be surprised to see Bryce Harper in the mix either as the default “best player on a playoff team” voting scheme takes over.
  • NL Cy Young: Stephen Strasburg, who won’t have as good of numbers as Clayton Kershaw but gets the nod because of east coast bias.
  • NL Rookie: Jedd Gyorko, though Julio Teheran could finally have it figured out.
  • NL Manager; I have no idea; this usually just goes to the most “surprising” team and I don’t see many surprises in the NL this year.  Bruce Bochy.

One more reason I hate the WAR stat

5 comments

As pointed out in this Hardballtimes story by Matt Hunter, here’s two opening-day pitching lines:

Matt Harrison: 5.2 IP, 6 R, 5 ER, 9 K, 3 BB, 0 HR, 0.2 WAR
Stephen Strasburg: 7 IP, 0 R, 0 ER, 3 K, 0 BB, 0 HR, 0.2 WAR

Wait.  Strasburg’s 7 shutout innings in which he only allowed 3 base runners is somehow considered an “equal” performance in terms of FanGraphs WAR to Harrison’s 5 2/3 inning 5 earned run debacle??

The reason why (as explained much better in the Hunter link) is because Fangraph’s WAR is based on FIP, and despite Harrison’s line and despite the fact that Strasburg didn’t give up any runs Harrison’s FIP was actually lower than Strasburg’s for the day.  FIP only measures Ks, BBs and Homers, and because Harrison had many more K’s on the day his FIP is better.

Here’s my problem; how can you possibly trust a statistic that is this blatantly wrong on an individual game level?  Both WAR and FIP accumulate over the course of a season to arrive at a measure for a player’s performance, yet clearly they both have significant individual-game issues.  And as Hunter points out (paraphrased),  “if you can’t trust a stat on a per-game basis, you can’t *really* trust the stat on a full season level.”

I point this out because there are far, far too many stat-heavy baseball writers out there who will literally call you an idiot if you dare use “old time” statistics to measure a player’s season … but who also use the likes of WAR and FIP as the be all-end all replacements.  And that’s where I have a problem.

And all of this is to say nothing of the heavy reliance of defensive stats on WAR, defensive stats which didn’t exist 10 years ago (so how “good” or “bad” are our historical players?) and defensive stats which are admittedly flawed when it comes to doing what they’re supposed to do unless every player stands in exactly the same spot at every position on every play all year?  If your team employs lots of infield shifts (like say a Tampa Bay), guess what?  Your UZR rating looks fantastic.  If you play in a big pitcher’s park and have a fly-ball pitcher on the mound (think San Francisco and Matt Cain), your UZR looks awesome as you chase down lazy flyball after lazy flyball.  Defensive stats can’t take into account first basemen digging out throws or measure nearly any component of catching defense outside of the basic counting stats we already had (errors, caught stealing, passed balls).

I don’t know what the solution is.  But I know it isn’t to claim that WAR is the ultimate player measurement stat that lots of people believe it to be.

Written by Todd Boss

April 4th, 2013 at 1:37 pm

Are we too worried about pitch counts?

4 comments

Ohmygod Strasburg only threw 80 pitches on opening day what's wrong with him?! Photo: howtowatchsports.com

The Nats handling of Stephen Strasburg in 2012 certainly caused more than its fair share of discussion in the sports world, to the point where people (read, me) don’t really want to talk about it anymore because they’re too hunkered down into their own opinions on the matter.  Hence a sense of relief washed over Mike Rizzo defenders when 2013 rolled around, knowing that “the reins were off” (how many times have we heard that cliche so far this year?)

So what happens on Opening Day?  Strasburg gets lifted after 80 pitches and sets of another mini fire-storm of discussion (also witness here and here).   “Why’d he come out?  Is he hurt?  Are the Nats over-protective?  Are they limiting his pitches??”  *sigh*  No dammit; there’s about Zero good reasons to push any pitcher in April, the Nats have a strong bullpen that will need work, and if your guy isn’t going 9, why bother pushing him through 8 if you don’t have to?  Here’s an interesting observation for those who think he got pulled too early; check Strasburg’s 2012 game logs and look what happened on Opening Day 2012: he went 7 innings on 82 pitches and left.  Wow; its like deja-vu!  Except nobody heard a peep about it last year.  Baseball writers are such hypocrites sometimes (ok rant off).

Note: here’s a story on Grantland from last September from writer Rany Jazayerli, who writes the very good “Rany on the Royals” blog and who does possibly the best baseball podcast out there with Joe Sheehan, talking about pitch counts and the Strasburg situation.  I don’t want to bring back up the Strasburg shutdown situation (which he argues should have happened later than it did) but he has links to other studies on this topic.

Anyway; the situation got me thinking about an old draft post I had about Pitch Counts in general, that stemmed from a podcast conversation on the topic from months ago.  Just last week I posted about Johan Santana, who re-injured his surgically repaired shoulder in 2012 pretty much the day after he was allowed to go 134 pitches to complete a no-hitter.   The general consensus among baseball pundits and professionals is that 100 pitches per outing is a good “benchmark” for starters.  If you get much above 110-115 pitches in an outing you’re pushing it.

But do these pitch counts make sense?  In 2007 Little League established a new set of guidelines for youth pitching limits, going away from the old innings pitched per week limits and going by pitch counts.  Here’s the general guidelines for pitch count limits and for mandatory rest periods now in place for youth baseball:

Age Max Pitches per Day Mandatory Days rest if throw Max
7-8 50 2 days
9-10 75 3 days
11-12 85 4 days
13-16 95 4 days
17-18 105 4 days

Basically, if you throw 76 or more pitches in a day, you’re sitting for 4 days, and the max pitches you can throw gradually rises as you age, topping out at 105 pitches for 17-18 year olds.  There’s a graduating rest scale for throwing fewer pitches by the number and by age (see the above links for exact details if you’re interested).

But here’s the point of this list; If its “ok” for a 17 year old amateur to throw 105 pitches and then rest for four days …. are you really telling me that a Major League Starter, a professional athlete paid millions of dollars with access to the best coaching and training staffs available, a man who is conditioned and trains year round to do nothing BUT throw a baseball for a living … you’re telling me that this person also works more or less off of a 100 pitch limit??

Are we too worried about pitch counts?  If Strasburg hits 115 pitches, are we really going to start talking about how the world is ending and how Davey Johnson is abusing his pitcher?  What is a more realistic pitch count limit for professionals?

Research seems to show that there is a Pitch Count threshold at which even professionals seem to be affected.  And that limit seems to be right around 120 pitches per outing.  This Baseball Prospectus study in 2002 by Keith Woolner shows that a 120+ pitch outing will result in a distinct drop-off in subsequent pitching performances in pitchers for the next few weeks, supporting the notion that you can really “over-work” a pitcher to the detriment of his health (as we saw with Santana clearly; his ERA pre and post 134 pitch performance in 2012 was 2.75 and 8.27).  I just wish this research was updated: he based it off of stats from a decade ago and I feel like enough has changed in the game that the study needs revisiting.

I can’t find any “in-game” pitch count studies showing how much a pitcher’s performance dropped off after the 120th pitch, but the BP study mentioned here is really the concern.  If your performance is impacted for weeks after a long outing, that’s proof enough for me to yank a guy before he gets to 120 pitches in a game.

So perhaps we SHOULD be worried about pitch counts, but only if we get someone above 120 pitches.  Here’s a quick glance at the max pitches our 5 starters threw last year:

  • Strasburg: 119 pitches on June 8th in Boston, a season-high 13 Ks.
  • Gonzalez: 119 pitches on Aug 31st to finish off a 5-hit shutout against St. Louis.
  • Zimmermann: 112 pitches on Sept 29th against St. Louis, his final start of the regular season.
  • Jackson: 123 pitches on Aug 30th to complete 8 innings of 4-hit ball vs St. Louis.
  • Detwiler: 100 pitches on May 25th to labor through 4 1/3 in Atlanta.

and just for good measure:

  • Haren: 126 pitches on May 24th vs Seattle to finish off a 4-hit shutout with 14 Ks.

You can see how managers sometimes go against their better judgement to allow pitchers to finish off shutouts and no-hitters.  Two of these six pitchers had their highest totals trying to finish off shutouts.  How do you tell a guy with a shutout through eight innings that he’s done because he’s reached some arbitrary pitch limit?   Interestingly, Johnson allowed two of his guys to get their highest totals in the August show-down series with St. Louis.  What’s also interesting about the above numbers is just how little Detwiler was trusted; his MAX effort all year was 100 pitches; talk about being treated with kid gloves.  I wonder if he’s going to be trusted to go deeper into games this year.

Conclusion: I’ll now scoff anytime someone whines about a 100 or 110 pitch limit for a pro, but will go bananas if our guys broach 120 unless there’s mitigating circumstances.

(post-script: Counter point from Jeff Passan who talks about pitch count abuse done to the obscene in Japan).

Opening Day Starter Trivia

one comment

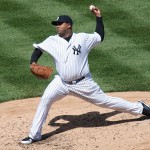
Sabathia is your current Active leader in Opening Day starts. Photo wiki/flickr chris.ptacek

One of my favorite annual trivia questions amongst my baseball buddies revolves around Opening Day Starters.  With another Opening Day in the books, here’s some useless trivia related to Opening Day starters for my readers.  I’ve uploaded my little Opening Day Starters spreadsheet to Google Docs and created a link in the “Nationals Arm Race creation” section along the right.

Current Active Leaders in Opening Day Starts

10 Roy Halladay
10 CC Sabathia
9 Mark Buehrle
6 Bartolo Colon
6 Derek Lowe
6 Tim Hudson
6 Felix Hernandez
6 Justin Verlander
5 Aaron Harang
5 Josh Beckett
5 Jered Weaver
5 James Shields
4 Jake Peavy
4 Barry Zito
4 Tim Lincecum
4 Yovani Gallardo

Those players bolded in the list above had 2013 opening day starts and added to their totals.  Roy Halladay‘s difficult spring training cost him his shot at Opening Day and thus CC Sabathia moves into a tie for first.  Mark Buehrle has given over the reigns of opening day starter possibly for good, based on his standing in the Toronto rotation (4th starter?).

Felix Hernandez and Justin Verlander have chances to broach the all-time records (see below) based on their ages, their current counts and their new long-term contracts.

Current Active Leader in consecutive Opening Day Starts: Verlander with 6 straight.

Most ever Opening Day Starts all-time: Tom Seaver with 16 in his career.

Most ever Consecutive Opening Day Starts: Hall of Fame lightning rod Jack Morris, who made 14 straight such starts.

Number of first-time opening day starters in 2013: no less than 13 first timers this year, nearly half the league.   Some guys got deserved first-time opening day starts (Jeff Samardzija, Matt Cain, and R.A. Dickey), some guys got Opening Day starts mostly out of attrition of other worthy pitchers (Jon Niese, Bud Norris, A.J. Burnett, Vance Worley and Jhoulys Chacin) and some guys are taking over as the new big-dog of their rotations (Brett Anderson, Chris Sale).

Who seems most likely to break Seaver’s Record at this point? Sabathia, who already has 10 opening day starts, is clearly the #1 in New York, is only 32 and still has five years on his current deal.  Question is, if he renews past 2017, can he still earn the #1 spot?   Meanwhile Hernandez already has 6, just signed a deal that takes him through 2019 with a relatively easy option for 2020.   That’s 8 more seasons on his existing 6 opening day starts and he’d only be 34 years of age.   He could be the standard holder if he stays healthy and continues to pitch like an ace.

DC-IBWA Pre-2013 Season Predictions

leave a comment

I took part in the DC-IBWA’s pre-season survey this year (despite this blog being missing from the “participants” page on the result link…) along with many of our fellow Nats bloggers.  The full results are here; I gave both a player and a guess on the totals, and compared my guesses to the poll results.

1) Who will lead the Nats in home runs in 2013? Bryce Harper, 35hrs.  Makes sense that Harper takes the lead; Morse is gone, Zimmerman has only shown 30-homer power in one injury-free season and I think Harper is a dangerous bet for a 30/30 season in 2013.  (Harper was the poll leader as well).

2) Who will lead the Nats in RBI?: Adam LaRoche, 105rbi.  The #5 hitter behind a slew of high OBP guys in front of him is going to get plenty of RBI opportunities.  Most people said Zimmerman; I just constantly worry about his ability to play 162.

3) Who will lead the Nats in stolen bases? Ian Desmond, 25sbs.  Most people guessed Span, but he hasn’t been the SB machine that people think.  Desmond is a better bet.

4) Who will lead the staff in wins? Stephen Strasburg, 20wins.  As good a guess as any.  It wouldn’t surprise me to see any of our top 3 pitchers broach 20 wins.

5) Who will make more appearances for the Nats this season: Rafael Soriano, Drew Storen, Tyler Clippard or Craig Stammen? Tyler Clippard, 70games.   The addition of Soriano allows Clippard to go back to his work-horse self, and he’ll lead the team in appearances again.  Soriano will only get save opps, Storen is too close to being the closer to get the workhorse treatment, and Stammen isn’t going to throw unless the starter gets yanked early.   (Clippard was the poll leader as well)

6) Who will get more at bats for the Nats this season: Kurt Suzuki or Wilson Ramos? Hmmm.  Tough one.  I’ll go with Suzuki with 400ab.  I don’t think Ramos can stay healthy.  I could be wrong; Ramos seems to have won the starter role at least from the onset.  Poll favored Ramos.

7) Which minor leaguer are you most interested in keeping tabs on this season? Matt Purke.   We know what our top two guys can do for the most part (Rendon and Goodwin).  Giolito is basically out all year and Cole needs a full season in A-ball to regain confidence.  Purke needs to show us something in 2013.  He seems to be healthy, and we need to know if the monetary investment is going to pay off.  A close second may be Matt Skole; can he make the leap from over-aged low-A slugger to a legitimate power prospect who could take over 1st when LaRoche’s contract ends?  So far from spring training, it seems like the answer could be a yes.  (Poll winner was Rendon easily).

8 ) Date of Anthony Rendon’s Major League debut? July 1.  Long enough to ensure one additional year and avoid super-2.  The club gives Espinosa 3 full months to show he’s healthy and can hit better than .240.  I could easily see more Espinosa struggles, a DL trip to repair his shoulder and Rendon taking over 2B for the 2nd half.  I hope not; he’s my fantasy shortstop :-).   Poll winner was Sept 1.

9) How many all-stars will the Nats have? Who? 4; Strasburg, Gonzalez, Harper and Desmond.  The Poll results were all over the road, but lots of support for Zimmerman to re-gain his all-star stature.  Problem is … there’s a few big names at third base in the NL that Zimmerman would have to out-perform to get votes.  David Wright and Pablo Sandoval first among them, perhaps David Freese and Chase Headley as well.

10) Total wins and what place in the division? 100 wins, 1st in division.  Most people have the team pegged for slightly fewer.

Essay: What should be the single most important development for the Nats this season?

I think the overall health of the Rotation is going to be the biggest factor for the team.  We have no starting pitching depth to speak of, and a lengthy injury to any of the front line pitchers will affect our win total.