Nationals Arm Race

"… the reason you win or lose is darn near always the same – pitching.” — Earl Weaver

Archive for the ‘justin verlander’ tag

MLB Divisional Series Predictions

5 comments

After a pretty unbelievable 6 minutes last night, where the Red Sox snatched defeat from the hands of victory and then the Rays had a walk-off win to an amazing comeback (not to mention the Braves losing a heart-breaker to finish off their own September collapse earlier in the nigth), we have a completely different playoff picture than most people predicted just last week.  Lets take a look and put up some predictions.

First off, 3/8ths of these teams were in such scramble mode just to make the playoffs, they havn’t really even declared probable pitchers yet.  But i’ll put in some guesses.

GM# Home-Visitor Visiting Starter Home Starter Advantage
1 Det-NYY Verlander Sabathia Det
2 Det-NYY Fister Nova NYY?
3 NYY-Det Garcia Scherzer Det?
4 *NYY-Det Sabathia Porcello NYY
5 *Det-NYY Verlander ? Det
1 TBR-Tex Neimann Wilson Tex
2 TBR-Tex Shields Holland TB?
3 Tex-TBR Lewis? Price? TB
4 *Tex-TBR Harrison Hellickson? TB?
5 *TBR-Tex Neimann? Wilson Tex
1 Ari-Mil Kennedy Gallardo Ari?
2 Ari-Mil Hudson Marcum Mil
3 Mil-Ari Greinke Saunders Mil
4 *Mil-Ari Wolf Collmeter Ari?
5 *Ari-Mil Kennedy Gallardo Mil?
1 Stl-Phi Lohse Halladay Phi
2 Stl-Phi Garcia Lee Phi
3 Phi-Stl Hamels Jackson? Phi
4 *Phi-Stl Oswalt Carpenter Stl
5 *Stl-Phi Lohse Halladay Phi

By Series Thoughts:

  • Detroit-New York: Detroit took the Season series 4-3 and is on a roll.  New York basically has no idea who is going to pitch the 3rd game (Garcia?  Colon?  Burnett?) or the 5th game, and the 4th game would be Sabathia on 3 days rest.  Detroit is essentially a 1 1/2 pitcher rotation right now, with Verlander unbeatable and Fister just as good.  Game 3 is the toss-up; which 4+ ERA starter will cave first?  Prediction: Detroit in 5.  Supplemental prediction: New York over-reacts and gives CJ Wilson $180M in the off season after having zero pitchers left in game 3.
  • Tampa Bay-Texas: Texas took the season series 5-4, but Tampa is obviously hot entering the post-season.  Tampa’s pitching staff was shredded just to get into the playoffs, leaving them at a disadvantage.  They burned their ace Price last night (and he got hammered), meaning they likely can’t use him til game 3.  Meanwhile, arguably their 5th best starter (Neimann) looks likely to get two starts because of the scheduling.   Unless the team puts uber-prospect Matt Moore on the roster and puts him into the rotation.  Despite all that, the Rangers themselves have a conundrum in that the matchups don’t really favor them, at all.   I don’t think the Rangers can beat Shields in game2, and may struggle to beat Price with their #5 starter Colby Lewis going in game 3.  The pivotal game is game 2: can Texas hold serve at home?  Prediction: Tampa in 4.
  • Arizona-Milwaukee: Arizona took the season series 4-3.  This is a strange series; if Arizona’s pitching is for real, this could be a great series.  If not?  It could be a quick sweep for Milwaukee.  Arizona needs to win both of their Ace Ian Kennedy’s starts to have any shot, but both will be on the road.  The pivotal game could be game 4, with the veteran Randy Wolf going against the surprising elder rookie Josh Collmeter.  Prediction: Milwaukee in 5.
  • St. Louis-Philadelphia: the one team Philly didn’t want to see in the post-season; St. Louis took the season series 6-3.  However, Chris Carpenter was burned just to get into the post season, meaning they likely won’t see him until game 4.  By which point Philly may very well have swept this series.  St. Louis’ pitching isn’t that great this year, with all their starters posting good ERAs but not really dominant lines.  Philadelphia really struggled down the stretch; we’ll find out soon enough if its because they were tired or just complacent by having locked up the #1 seed so early.  I’m guessing their 4-game winning streak to end the season (including the dagger-like 3-game set in Atlanta to cost them the WC) means they’re geared up.  Prediction: Philadelphia in 3

If this plays out, we’re looking at Milwaukee-Philadelphia and Tampa-Detroit for ALCS.  Not as compelling as MLB wants, but some good story lines none the less.  Could be a Philly-Tampa 2008 rematch world series.  We’ll revisit predictions after the divisional rounds are complete.

Nats Rotation Cycle #15: good/bad/soso

3 comments

It is good to have the Face of the Franchise back. Photo unknown credit via fantasyknuckleheads.com

The Nats finally get Ryan Zimmerman back into a suddenly potent lineup, and continue their longest winning streak in several years.  How’d our guys fare heading into the weekend Interleague series with the Orioles?

Good

  • Livan Hernandez pitched perhaps his best game in a Nats uniform on June 15th (box/gamer) against the powerful St. Louis lineup.  A 3-hit shutout.  Three errors and 4 bombs from his improving offense definitely helped, but he would have won this game even with his typical crummy run support.  Game score on the night: 87.  Nice.  (Verlander‘s no hitter on May 7th scored a 90, for comparison purposes).  For a nice overview of the Bill James Gamescore, and a list of the greatest pitching performances in National’s history, read Zuckerman‘s piece here.
  • John Lannan continues to look like a different pitcher than earlier this season, throwing his sixth straight quality start in the St. Louis series finale on 6/16 (box/gamer).  He was denied the spoils of victory though, with Danny Espinosa‘s walkoff 3-run shot giving Burnett a victory.  The win pulled the Nats out of last place in the NL east for the first time this late in the season since perhaps 2005.
  • While not quite as dominant as his past few starts, Jordan Zimmermann threw yet another quality start in saturday 6/18’s game versus Baltimore (box/gamer).  He went 6 1/3, giving up 2 runs on 8 hits for his 9th consecutive quality start.  In that time he’s driven his ERA from 4.55 to its current 3.08, good enough for 12th in the NL as of 6/19.  Can we say “second Ace” yet?

Bad

  • Jason Marquis somehow willed his way out of 12 hits in less than 6 innings without giving up a dozen runs, settling for 4 against the Orioles on friday night (box/gamer).  The Orioles certainly did not hit well with RISP, and it cost them as the Nats bats continued to be hot and they extended their winning streak.
  • Tom Gorzelanny‘s return from the DL was poor: he failed to get out of the 5th inning and got pounded by the Orioles to end the Nats 8-game winning streak on 6/19 (box/gamer).  He gave up 10 hits for 5 runs (4 earned) on the afternoon.  No strikeouts for the team’s leading k/9 guy, making you wonder if he’s rushed back from his injury.  His velocity seemed ok and he was pitching to contact … but the Orioles aren’t exactly a weak-hitting team.  We’ll have to hope for a stronger start next time out.

Starter Trends: Lannan and Zimmermann continue their hot streaks, Livan continues his yo-yo-ing of performances, and Marquis gets a win on a day he got hit around pretty badly.

MLB Trends (through gorzelanny 6/19)
Lhernandez         soso,soso,good,bad,great
Marquis                soso,good,good,good,bad
Lannan                  great,good,good,good,good
Zimmermann     good,good,good,great,good
Gorzelanny         good,bad,soso,bad->dl,bad

Relievers of Note

  • Boy its nice to see a bullpen full of shut-down arms.  A quick glance at the ERA+ stats of our bullpen as of 6/19 offers up some pretty dominant figures.  Storen-159, Clippard-197, Rodriguez-219, Coffey-183, Mattheus-infinite (he’s yet to give up a run in two appearances).  Only Balester and Burnett have sub 100 figures.  The ERA+ is a bit deceptive for certain people (for example, Doug Slaten has a 179 figure despite a god-awful WHIP and a horrible inherited runners-scoring track record) but for the most part does a good job characterizing the performance of pitchers over the long haul.

Thoughts on the offense

  • Rick Ankiel can’t seem to catch a break this season, going back on the DL to let a strained rib cage muscle heal properly.  The move was fortuitous for the Nats, who needed to activate Tom Gorzelanny to make his 6/20 start and offers a stay of execution for (likely) Brian Bixler on the active roster.
  • 6 of the 8 starting hitters for this team now feature OPS+ stats > 100.  Only Desmond and Bernadina (who just missed out with a 95 OPS+) are struggling to join the hit parade.
  • More importantly for our power-starved team, with 43% of the season gone we’ve got 4 players on pace to eclipse 20 homers on the season (Werth, Nix, Morse and Espinosa), and Zimmerman may pick up the pace and threaten that same mark.  Espinosa is noteworthy as the team leader, currently on pace for 27-28 homers during his rookie season, from the 2nd base position.  He may become a very valuable player indeed.

The importance of Home grown Starting Pitching

5 comments

Clay Buchholz provided the best Wins/salary in the majors last year. Photo baseballrumormill.com

A few weeks back si’s Tom Verducci posted an article discussing the value of starters over closers.  One of the points that he made in the article related to the general fact that Ace Starters are more likely to be with the same team that developed them than being free agent acquisitions in the modern game.  In Verducci’s article, he analyzed the 20 best pitchers by ERA from last season and found that 13 of them are still with their original organization.  Furthermore, 10 of them were first round draft picks.

Modern baseball teams are being built more and more through the draft.  Last year’s World Series champions San Francisco featured 4 home grown starters, each of whom would slot in as the best or 2nd best pitcher on most every other rotation in the league.  Tampa Bay rode a slew of home-grown (and cheap!) starters to the 2nd best record in Baseball over the past 3 years.  And now we clearly see Mike Rizzo trying to build up his starting pitcher cache in the minors through mid-season trades and a focus on pitching in the past couple drafts.

I thought I’d take this point a bit further, as it relates to a topic that I have found more and more fascinating.  The New York Yankees and their $200M payroll struggled to find starting pitching in the off season and are now essentially conducting tryouts in spring training for the #4 and #5 starter spots in their rotation.  How did they find themselves in this predicament?  The answer is thus; it has been years since they developed a home-grown Ace starter.  Their best pitcher (CC Sabathia) was a (very) expensive Free Agent, their 2nd best a home grown rookie (Phil Hughes) and their third best (AJ Burnett) another pricey free agent.  Arguably it has been since either Chien-Ming Wang or possibly Andy Pettitte that the Yankees have developed a starter worthy of mention.  Now, the Yankees have certainly bought themselves a whole lot of offense that will mask their weaknesses in the rotation, but the fact remains that they could easily miss the playoffs in 2011 despite their payroll if the first three members of their rotation do not pitch well.

Lets look at the “Aces” in baseball, and take a look at their acquisition methods and their contract status.  Here, “Home Grown” means the team that developed the pitcher, not necessarily the team that drafted him.  When prospects get traded, I credit the acquiring team for developing and delivering the player to the majors.

  • Home Grown: Johnson, Hamels, Wainwright, Jimenez, Lincecum, Cain, Lester, Buchholz, Price, Verlander, Liriano, Felix Hernandez, Jered Weaver.
  • Free Agent Acquisition: Halladay, Lee, Carpenter, Sabathia.
  • Trade Acquisition: Oswalt, Santana, Greinke.

Of these 20 “Aces,” 13 are still with their developing organization.  Four Free Agent acquisitions for big money, and three traded Aces that cost their teams plenty (though in retrospect the Johan Santana trade isn’t looking that bad for the Mets).

Another side-point was Verducci’s findings that 10 of the top 20 pitchers by ERA last year were first rounders.  I find that piece of information really amazing, given the notorious “crapshoot” mentality of baseball Drafts.  Here’s a quick followup analysis of the Initial Acquisition method of my 20 “Aces” and determining draft or international free agent. Here, we’ll put “supplemental first rounders) into the “1st round” category.

  • Draft: 1st Rounder: Hamels, Halladay, Carpenter, Wainwright, Greinke, Lincecum, Cain, Buchholz, Price, Sabathia, Verlander, Jered Weaver.
  • Draft: top 5 rounds: Johnson (4th), Lee (4th), Lester (2nd).
  • Draft: 6th round or later: Oswalt (23rd).
  • International Free Agents: Santana, Jimenez, Liriano, Felix Hernandez.

So by my analysis, 12 of the best 20 pitchers in the game were first round picks.  Only Oswalt looks like a complete diamond in the rough find.  For all the talk about how the draft is a crap shoot (hey, Albert Pujols was a 13th round pick), it really seems apparent that these first rounders paid off handsomely.

Here’s one more look; of the 13 “home grown” aces, lets look at their current contract status.  All data per Cot’s fantastic salary database site.

  • Johnson: 4 years/$39M (2010-13)
  • Hamels: 3 years/$20.5M (2009-11), but he has a 4th arbitration year in 2012.
  • Wainwright: 4 years/$15M (2008-11), plus 2012, 2013 club options (this contract is in complete peril though, since the club can terminate at the end of 2011 when Wainwright is on the DL.  That essentially kills $21M guaranteed to Wainwright in 2012 and 2013.  Tough, tough break for the player).
  • Jimenez: 4 years/$10M (2009-12), plus 2013-14 club options (the club options are very reasonable for an Ace)
  • Lincecum: 2 years/$23M (2010-11), but these are just his first two arbitration years.  Two more to go to take him through 2013.
  • Cain: 3 years/$27.25M (2010-12)
  • Lester: 5 years/$30M (2009-13), plus 2014 club option
  • Buchholz: 1yr/$480K (est): Still on a pre-arbitration contract, possibly the best value in baseball right now.  Controlled through 2014 by the Red Sox.
  • Price: 6 years/$8.5M (2007-12).  Wait, actually THIS may be the best deal in baseball, since Buchholz will probably garner a massive first-year arbitration award in 2012 just as Price’s 6 year deal ends.  However, Price can void the contract and file for arbitration as soon as he becomes eligible, presumably for the 2012 season.
  • Verlander: 5 years/$80M (2010-14)
  • Liriano: 1 year/$4.3M (2011).  Still in his arbitration years, under club control through 2012.
  • Felix Hernandez: 5 years/$78M (2010-14)
  • Jered Weaver: 1 year/$7.37M (2011).  He lost his arbitration hearing this year after going “only” 13-12 but leading the league in strikeouts and coming in 5th in Cy Young voting.  Under club control through 2012.

And, adding in the non-home grown players for a complete picture of the future Ace starter FA market:

  • Halladay: 3 years/$60M (2011-13), plus 2014 option
  • Lee: 5 years/$120M (2011-15), plus 2016 option
  • Carpenter: 5 years/$63.5M (2007-11), plus 2012 club option
  • Sabathia: 7 years/$161M (2009-15) but he can opt out after the 2011 season
  • Oswalt: 5 years/$73M (2007-11), plus 2012 club option
  • Santana: 6 years/$137.5M (2008-13), plus 2014 club option
  • Greinke: 4 years/$38M (2009-12)

So, here’s a quick summary of when these Aces may hit the FA market:

  • After 2011: Wainwright (but he’ll be post-TJ surgery), Sabathia (probably)
  • After 2012: Cain, Liriano, Weaver, Oswalt, Carpenter, Greinke, Hamels
  • After 2013: Johnson, Lincecum, Santana (probably)
  • 2014 or Beyond : Jimenez, Lester, Buchholz, Price, Verlander, Hernandez, Halladay, Lee

Notice how teams are locking up these Ace pitchers for the long haul.  We’re likely to have perhaps just an injury reclamation project in Adam Wainwright and opt-out 100% certain to return to the Yankees Sabathia as the sole major  free agent candidates this coming off season.  I’ve read differing opinions on whether or not Sabathia opts out of his contract (he’d be abandoning $92M of guaranteed pay over 4 years) but I’d be surprised (shocked actually) if he did NOT opt out, especially if he has a third consecutive year of similar production to his first two for the Yankees.  You would have to think he could easily merit a contract north of Cliff Lee’s $24M/year for 7 additional years.  7yrs/$170M or so.

Lastly, lets look at the 8 playoff teams from last  year and investigate how many of their starters were home grown:

  • Giants: 4 of 5 homegrown (Lincecum, Cain, Sanchez, Bumgarner).  1 FA in Zito
  • Rangers: 3 of 5 home grown (Wilson, Hunter, Feldman), 1 trade acquisition (Lee), and one FA (Lewis)
  • Yankees: 1 home grown (Hughes) and 4 Free Agents (Sabathia, Burnett, Pettitte, Vazquez)
  • Phillies: 1 home grown (Hamels), 3 traded acquisitions (Halladay, Oswalt, Blanton) one FA (Moyer).
  • Rays: 4 home grown (Sheilds, Neiman, Price, Davis) one trade acquisition (Garza)
  • Twins: 3 home grown (Baker, Blackburn, Slowey) one FA (Pavano) and one trade acquisition (Liriano).
  • Braves: 3 home grown (Hanson, Jurrgens, Medlen/Minor), one FA (Lowe), one trade acquisition (Hudson)
  • Reds: 3 home grown (Leake, Bailey/Wood, Cueto), two trade acquisitions (Arroyo and Harang).

Six of the Eight playoff team used rotations that were mostly home grown.  Most of the trade acquisitions here were trading of prospects (either the acquiring team using prospects to acquire a proven Vet, as with Hudson, or the acquiring team acquiring and developing the player, as with Garza).

What is the lesson, after all this analysis?  Draft well, develop well, and then lock down your Aces for the long haul.  That is the pathway to success.  There are some exceptions of course (the Phillies have acquired 2 Aces by leveraging their very good farm system depth, and still have enough lower-level depth to rank among the best farm systems in baseball.  And the Yankees of course have bought themselves a good portion of their team).  But looking at the playoff teams last year, most of them were draft-heavy on starters.

Coincidentally; the Nats 2011 rotation by way of comparison?  2 drafted (Lannan, Zimmermann), 2 FAs (Livan and Marquis) and one trade acquisition candidate (Gorzelanny).  This would look far better of course if we were using two key drafted/developed players (Strasburg, Detwiler or even Maya).

Here’s hoping that the Nats’ higher-end starting pitcher draft picks (Strasburg, Zimmermann Solis, Cole, and Detwiler) become the core of our rotation for years to come.

Contract Value for FA Starting Pitchers; the Cliff Lee lesson-to-be

4 comments

Cliff Lee. Photo: Al Bello/Getty Images

As Cliff Lee continues to dazzle in the post season (his most recent effort being his 8inning, 2hit 13k gem against the most potent offense in Baseball, your NY Yankees), rumors of his purported price tag in the Free Agency market continue to reach spiraling heights.  The most common numbers thrown out start at 5yrs, $25M per.  One author at Forbes thinks he may approach $200M for 6 years combining salary and endorsements.

If you are trying to compare talent to contract value, then you have to start with the highest paid pitchers at current.  CC Sabathia is at $23M/year, Johan Santana is at $22.9M/year on average, and Roy Halladay took a slight discount to sign with Philadelphia (and be able to live in his offseason Odessa home 2 extra months of the year and drive to Spring Training) and is making $20M/year on his new deal.  Clearly, Cliff Lee has shown that he belongs at least at the $20M/year scale.  But how much higher makes sense financially for the signing team?

Forgetting for the moment that payroll means very little to a team like the New York Yankees (unfortunately his likely destination), lets talk about the value of the Free Agent contract and whether a team that gives out a $25M/year contract can ever really get their money’s worth.  Baseball is filled with horror stories of huge FA contracts that went bust.  Names like Zito, Dreifort, Pavano, Neagle, and Hampton fill general managers and fan’s heads with dispair.

How bad were these contracts?  I put together a spreadsheet with every significant starting pitcher FA contract that I could find, then cross referenced it by the Pitcher’s Won/Loss record during the duration of the contract.  See below: the table is sorted in reverse order of $/win.  In addition to the major FA contracts, I also arbitrarily added every “Ace” starter in the league, resulting in names like Lee, Jimenez, Price and Buchholz being in this list despite not being major FA pitchers (yet).  Their inclusion illustrates one of my major conclusions below.

Pitcher Team Total Value (includes club options) $$/year Avg Contract Term W/L $ per win
Kei Igawa New York Yankees $46,000,000 $9,200,000 2007-11 2-4 $18,400,000
Jason Schmidt Los Angeles Dodgers $47,000,000 $15,666,667 2007-09 3-6 $15,666,667
Kei Igawa New York Yankees $20,000,000 $4,000,000 2007-11 2-4 $8,000,000
Darren Dreifort Los Angeles Dodgers $55,000,000 $11,000,000 2001-05 9-15 $6,111,111
Russ Ortiz Arizona Diamondbacks $33,000,000 $8,250,000 2005-08 7-22 $4,714,286
Roger Clemens New York Yankees $28,000,022 $28,000,022 2007 6-6 $4,666,670
Carl Pavano New York Yankees $39,950,000 $9,987,500 2005-8 9-8 $4,438,889
Denny Neagle Colorado Rockies $51,000,000 $10,200,000 2001-05 19-23 $2,684,211
Jake Peavy San Diego Padres $52,000,000 $17,333,333 2010-12 7-6 $2,476,190
Carlos Silva Seattle Mariners $48,000,000 $12,000,000 2008-12 15-24 $2,400,000
Mike Hampton Colorado Rockies $121,000,000 $15,125,000 2001-08 56-52 $2,160,714
Chan Ho Park Los Angeles Dodgers $65,000,000 $13,000,000 2002-06 33-33 $1,969,697
Barry Zito San Francisco Giants $126,000,000 $18,000,000 2007-13 40-57 $1,800,000
Johan Santana New York Mets $137,500,000 $22,916,667 2008-13 40-25 $1,718,750
Pedro Martinez New York Mets $54,000,000 $13,500,000 2005-08 32-23 $1,687,500
Carlos Zambrano Chicago Cubs $91,500,000 $18,300,000 2008-12 34-19 $1,614,706
Gil Meche Kansas City Royals $55,000,000 $11,000,000 2007-11 29-39 $1,517,241
Daisuke Matsuzaka Boston Red Sox $103,000,000 $17,166,667 2007-12 46-27 $1,492,754
Kevin Brown Los Angeles Dodgers $105,000,000 $15,000,000 1999-2005 72-45 $1,458,333
A.J. Burnett New York Yankees $82,500,000 $16,500,000 2009-13 23-24 $1,434,783
Roger Clemens New York Yankees $18,000,000 $18,000,000 2005 13-8 $1,384,615
Felix Hernandez Seattle Mariners $78,000,000 $15,600,000 2010-14 13-12 $1,200,000
John Lackey Boston Red Sox $82,500,000 $16,500,000 2010-14 14-11 $1,178,571
Jarrod Washburn Seattle Mariners $37,000,000 $9,250,000 2006-09 32-52 $1,156,250
Chris Carpenter St. Louis Cardinals $50,800,000 $12,700,000 2008-11 33-13 $1,154,545
Kevin Millwood Texas Rangers $60,000,000 $12,000,000 2006-10 52-62 $1,153,846
C.C. Sabathia New York Yankees $161,000,000 $23,000,000 2009-15 40-15 $1,150,000
Roy Oswalt Houston Astros $73,000,000 $14,600,000 2007-11 52-36 $1,123,077
Bartolo Colon Los Angeles Angels $51,000,000 $12,750,000 2004-07 46-33 $1,108,696
Mark Buehrle Chicago White Sox $56,000,000 $14,000,000 2008-11 41-35 $1,024,390
Ryan Dempster Chicago Cubs $52,000,000 $13,000,000 2009-12 26-21 $1,000,000
Derek Lowe Atlanta Braves $60,000,000 $15,000,000 2009-12 31-22 $967,742
Mike Mussina New York Yankees $88,500,000 $14,750,000 2001-06 92-53 $961,957
Justin Verlander Detroit Tigers $80,000,000 $16,000,000 2010-14 18-9 $888,889
Josh Johnson Florida Marlins $39,000,000 $9,750,000 2010-2013 11-6 $886,364
Pedro Martinez Boston Red Sox $92,000,000 $15,333,333 1998-04 117-37 $786,325
Bronson Arroyo Cincinnati Reds $25,000,000 $12,500,000 2009-10 32-23 $781,250
Josh Beckett Boston Red Sox $42,000,000 $8,400,000 2007-10 55-29 $763,636
Daisuke Matsuzaka Boston Red Sox $52,000,000 $8,666,667 2007-12 46-27 $753,623
Ted Lilly Chicago Cubs $40,000,000 $10,000,000 2007-10 54-21 $740,741
Zack Greinke Kansas City Royals $38,000,000 $9,500,000 2009-12 26-22 $730,769
Tim Lincecum San Francisco Giants $23,000,000 $11,500,000 2010-11 16-10 $718,750
Mike Mussina New York Yankees $22,141,452 $11,070,726 2007-08 31-19 $714,240
Matt Cain San Francisco Giants $27,250,000 $9,083,333 2010-12 13-11 $698,718
Roy Halladay Toronto Blue Jays $40,000,000 $13,333,333 2008-10 58-31 $689,655
Derek Lowe Los Angeles Dodgers $36,000,000 $9,000,000 2005-08 54-48 $666,667
Cole Hamels Philadelphia Phillies $20,500,000 $6,833,333 2009-11 22-22 $621,212
Jason Schmidt San Francisco Giants $40,000,000 $8,000,000 2002-06 71-36 $563,380
Brandon Webb Arizona Diamondbacks $28,000,000 $5,600,000 2006-10 56-25 $500,000
Jon Lester Boston Red Sox $43,000,000 $7,166,667 2009-14 34-17 $421,569
Adam Wainwright St. Louis Cardinals $36,000,000 $6,000,000 2008-13 50-22 $360,000
Cliff Lee Cleveland Indians $23,000,000 $4,600,000 2006-10 67-44 $343,284
Ubaldo Jimenez Colorado Rockies $23,750,000 $3,958,333 2009-14 34-20 $232,843
David Price Tampa Bay Rays $11,250,000 $1,875,000 2007-12 29-13 $64,655
Clay Buchholz Boston Red Sox $443,000 $443,000 2010 17-7 $26,059

Comment on Won/Loss records; yes I know that individual pitcher wins are not a great indicator of a starter’s worth.  However, they do reasonably indicate over the course of a longer term period the value of that pitcher to a team.  Perhaps a better argument is free agent dollars per quality start (despite the quality start measuring basically a mediocre start of 3ER or less in 6ip or more by a pitcher, it does generally correlate well to team wins andveven to a “real” quality start of 2ER or less in 6IP or more).  At some point I’ll re-run the analysis and count up QS per FA dollar to see how it compares.

Note for the purposes of this argument:

  • The Contract total value is averaged over the life of the contract, even if the payments are different during different years.
  • The W/L record is for the pitcher over the life of the contract, not necessarily for the original signing team.
  • If the contract is current (i.e., runs from 2009-2012) then I’ve only counted the completed regular seasons.
  • There are no off-season records taken into play.
  • I entered in both Japanese Pitchers (Igawa and Matsuzaka) with massive posting numbers twice; one factoring the posting fee and the other not.  Without the fee Dice-K looks halfway decent but with it he’s overpriced (something all Boston fans probably already knew about their highly paid #5 pitcher).

Conclusions.

– If  you can get 1 win per $1M expended, you are doing about average it seems.  Anything above $1.25M and you are looking at a questionable contract.

– It is difficult to look at any contract below $1M/victory and say that the team made a bad deal.

– The absurdly low $/victory values for David Price and Clay Buchholz demonstrate as clearly as possible the value of the pre-arbitration superstar.  Tampa Bay (who did a similarly shrewd deal with Evan Longoria, buying out the arbitration years and tying the player to the club past the 6-year pre-FA window) now gets Cy Young-quality starts from Price for the next two years at 1/20th his market value.  Buchholz is even more evident; at a pre-arbitration salary of $443,000 for 2010, he went 17-7 and gave the Red Sox #1 starter capabilities.  On the open market he’s worth at least $15M/year at that level of productivity.

– The worst FA contract ever given to a starting pitcher wasn’t one of the aforementioned infamous culprets; it belongs to one Kei Igawa.  The Yankees paid the posting fee of $26M just to negotiate with him, then signed him to a 5 year, $20M contract.  For that outlay of $46M guaranteed, the Yankees have gotten a record of 2-4 over parts of two seasons, and he hasn’t appeared in a MLB game since June of 2008.  Luckily the Yankees can afford it; this kind of FA mistake would cripple a mid-to-small market team for years.

Jason Schmidt‘s 3yr, $47M deal with the LA Dodgers is the largest $$ bust in terms of a pure FA play, not counting the vagarities of the Japanese posting system.  Schmidt had ironically just finished an incredibly efficient deal with San Francisco, where he went 71-36 over 5 seasons on a $40M contract (resulting in a very good $/win number of $563,380).  Six games into his Dodger career he went onto the DL list with shoulder injuries that eventually cost him the rest of 2007 and all of 2008.  He tried to regroup in 09, failed to make the team out of spring, made a few starts and was back on the DL.  All told, 3 wins in 10 starts for $47M.

– Some of the infamous deals do appear close to the top of this list; Neagle’s $51M for a 19-23 record.  Dreifort’s $55M deal resulting in a grand total of 9 wins and only 26 starts.  Ironically, the highest single season salary was Roger Clemen‘s $28M deal with New York in 2007.  For that money the Yankees got a middling 6-6 record.

– Are there any major FA deals that ARE paying off?  Well, you have to dig deep.  CC Sabathia has won 40 games for the Yankees in the first two years of his $23M/year deal, which is easily the best 9-figure deal.  However, it is early; we need to check back in years 6 and 7 of this deal.  Mussina went 92-53 for the Yankees after he signed his $88M deal in 2001.  Verlander won 18 games this year for his $16M annual salary and looks like a good bet to continue that trend.

– The BEST long term FA deal ever signed has to be Pedro Martinez‘s 6year $92M deal.  He went 117-37 between 1998-2004, won 3 Cy Youngs, had 2 Cy Young runners-up, and in the year 2000 posted an ERA+ of 291, which accounts for the best modern-day single-season pitching performance in the history of the game.

Bringing this back to Cliff Lee; the conclusion is thus; he may earn a $25M/year deal but the odds of his continuing to win 20-22 games/year for the duration of the contract and thus inflating the $/win value will eventually prove that contract to be an albatross (even more so if he misses significant time to injury at some point).

Did Chapman really throw a ball 105mph?

one comment

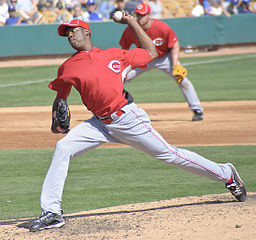
Chapman is amazing. Photo via wiki/flickr SD Dirk

Chapman is amazing. Photo via wiki/flickr SD Dirk

(Editor’s Note: This post was originally published on 9/2/2010, edited several times since, including links to the 105.1 pitch later in 2010 and him hitting 105.1 again in 2016, plus 2020 and 2022 readings and addition of additional links).

If you believe twitter and these published reports, Cincinnati’s Cuban prospect Aroldis Chapman “sat” at 103 and hit 105mph in his final AAA appearance before getting called up for the 9/1/2010 roster expansion.  I had a hard time believing it; the picture in the Yahoo looks doctored frankly, and stadium guns are notoriously “jacked up” to get the crowds excited and to spark interest in hard throwers.

There are two kinds of radar guns used by stadiums and scouts today.  A “fast” gun measures the speed of the pitch as it leaves the hand of the hurler while a “slow” gun measures its speed by the time the pitch crosses the plate.  For obvious reasons you’ll take the “fast” reading if you’re trying to hype the player, and you take the “slow” reading if you’re trying to evaluate the pitcher.  Oh, and you take readings over and again, compare first inning to last inning, etc.  My thoughts were that Chapman was on a fast gun that was over-exaggerated to add a couple MPHs (case in point; Jordan Zimmermann‘s radar readings on the telecast two nights ago put him at 96mph when his pitch f/x maximum was 94).  Click here for an excellent overview of the way we’ve measured velocity has changed over the years.

Now, that being said, check out the Pitch F/X data from Chapman’s first appearance in the majors on 8/31/2010, and his second appearance on 9/1/10. In his major league debut he threw 6 fastballs with an average of 100.65 and a max of 102.7mph.  This in and among itself would have been amazing and would have tied the fastest ever recorded pitch f/x data (that of Joel Zumaya hitting 102.7 in a game in June 2009)

However, look at the data from 9/1/10. He threw 7 fastballs that AVERAGED 102.11 mph with a peak of 103.9mph.  103.9!!


Before talking about new records, lets talk about history.

Now, I know there’s a ton of links out there talking about what the fastest ever reported pitch is on record (see links here or here at HardBalltimes or this google cache’d document as well as wikipedia or Guinness Book of World records links).

  • Walter Johnson was known for his power in the early part of the century; his fastball was estimated to be in the upper 90s by lore, and 91mph by testing.  Its a shame that modern technology didn’t exist back then.
  • Bob Feller being “recorded” using primitive measures in the 107mph range.
  • Steve Dalkowski’s legendary velocity being claimed at 110mph.
  • Nolan Ryan‘s “record” of 100.9mph has stood as some sort of altar to the speed ratings for years and years.

Lets discuss some of these points.

Bob Feller: So, what is the “proof” that Feller threw 107.6 in 1946?  Well, its complicated.  This ESPN article covers it: basically Feller threw a ball through a Lumiline Chronograph device, which hyper-accurately measured speed at the time.  His best measure was 98.6mph … but modern pitches are measured at the point of release, not where it crosses the plate.  So, you have to estimate how much velocity was lost from the point Feller tossed the ball to the device.  If you look at the photo (in the ESPN article), Feller was not throwing from the mound, but somewhere well forward of it.  So, to standardize speeds to some point closer to the release point of the pitch, we have to estimate the percentage loss of Feller’s pitch from an estimated delivery point based on a photo, then back into a number.  Some estimate this to be in the 103 range, others claim 107.6, which would imply he was throwing off the mound and experiencing the full expected velocity loss (which is clearly not true from the photo).  So I’d believe Feller was throwing roughly 103-104 based on where he released the ball … but its an estimate.  Add back 1mph for every 7 feet, and Feller seems to be standing at about 35 feet, so add perhaps 5mph to his 98.6 and you get the 103-104 rough estimate.

Coincidentally; the new standard is speed of the pitch measured at 50 feet from home plate.  This standardizes to allow for different release points by pitchers of different heights.

Steve Dalkowski: rumors of 110mph were mostly lore, but attempts were made to measure Dalkowski’s velocity.  Famously, he was measured at 98.6 at a military base in the 1960s, but there were some interesting caveats to that test.  According to this NYtimes article, the day Dalkowski attempted this test, he had thrown a 150-pitch start the DAY BEFORE, then had such a hard time throwing a baseball through the measuring device (he was notoriously wild) that it took him “dozens” of attempts before finally registering one pitch at the 98.6mph level.  It was the only known measurement of his arm ever done, and one has to think that (similarly to Ryan’s 100.9 speed below) he’d gain several mph just to standardize the speed to today’s 50-foot guidelines, and, frankly,  his arm was probably toast during the test.

(Side Note: if you’ve never heard of Dalkowski … his wikipedia page is a pretty good read).

Nolan Ryan: How about proof that Ryan threw 108.1, as is throw around the internet?  Well, It comes from the famous 100.9 reading he put up in a start in 1974.  However, that was reading was made using technology that, again, measured the speed closer to the plate than we currently do.  Per this article (which summarizes findings from a documentary called Fastball), the radar technology measured 100.9 ten feet from home plate, meaning we have to back up to the 50 feet estimate.  So, if the speed was measured at 10 feet, and we normally measure at 50 feet, we should add back “40 feet” of velocity loss, at around 1mph per every 7 feet, so call it somewhere between 5-6 mph … and we’re somewhere in the range of 106-107mph.  Not 108.1 as everyone claims; that’s adding back too much velocity and/or giving Ryan 10 feet more of credit (the measurement at the plate versus 10 feet in front).  These are still estimates of course; these speeds are also affected by the weather at the time (it was in Sept of 1974 in Anaheim … was that a humid day, an arid day?  Anaheim’s typical September weather is humid, hot; was it really humid that night?  Was it relatively dry?  That makes a huge difference in aerodynamics of a baseball and potential velocity loss.  So … we’ll never know.

Coincidentally, these velocity loss estimates are best documented by a physicist at the University of Illinois named Dr. Alan Nathan.  He estimates that baseball pitches lose 9-10% of their velocity from the point of release to the plate.  Example; if you release a ball at 100mph, it will generally measure at 90-91 by the time it crosses home plate.  Or, to put it easier … a pitch loses about 1MPH every 7 feet.

Other rumors and records for fast pitches suffer from perhaps hype and estimates, not science.  Zumaya reportedly hit 104.8 in the first game of the 2006 ALCS, but it was on the stadium gun, not Pitch F/X.  Ryan and Goose Gossage both reportedly hit 103mph in the 1978 All-Star game.  Stephen Strasburg reportedly could hit 102 as an amateur but rarely goes about 97 post-arm injury.  Justin Verlander may not have the triple-digit records but amazingly maintains his upper-90s throughout games, often hitting 100mph in his last inning of work.

I think Chapman’s speed last night is the new standard.  And a pretty amazing accomplishment.

Post publishing Editors notes: Chapman set a new MLB record on 9/24/10, after this article’s initial posting, throwing a documented 105.1mph.  He also threw a ball at 104.6 on 7/28/14.  Not quite as fast as his best ever … which I’m guessing even Chapman doesn’t think he’ll ever beat, since he got the reading tattooed on his wrist.  Then on 7/19/16,  years after his first record, he tied it again, throwing another ball 105.1.  Here’s the StatCast link for this pitch.  Coincidentally, this 105.1 pitch is now officially registered at 105.8 by MLB, because the technology we use now standardizes the pitch speeds at a specific distance, and Chapman’s 105.1 was measured further down from where we now standardize.

As of this writing, the Guinness Book of World records recognizes Chapman and 105.8 as the world records.

Post-posting related link: BA’s J.J. Cooper posted this Q&A session on 4/28/15 talking about Chapman and 101+ MPH pitches.

Jan 2017: Boston pitching prospect Michael Kopech, who is renowned his velocity, hit 110 MPH during a “max velocity” workout early in spring training by crow hopping.  Impressive, but not the same as throwing off a mound.  Holy mackerel!  How long before this kid gets to the majors and has a gun on him??

May 2018: we may have a new gold standard; Jordan Hicks threw a reported 105.1 MPH fastball, but Pitch FX shows it at 106.1.  (Unfortunately the PitchFX data at BrooksBaseball site now does not work, so my “evidence” is gone).  However, subsequent reporting on this pitch have lowered it to the mid 104s, so it remains unclear what its real velocity was to this day.

May 2022: University of Tennessee’s Ben  Joyce threw a pitch recorded at 105.5 in a college game.  Does Tennessee have Pitchfx?  Was this a juiced gun?  We’ll have to see.
Written by Todd Boss

September 2nd, 2010 at 12:21 pm

Baseball Salary Cap needed? Small payroll teams competing in 2010

one comment

Sports writers and baseball analysts have been beating the drum for years for some sort of payroll system modifications in baseball.   Especially in recent years with the dominance of the Yankees and Red Sox, who have been 1-2 in total salary for a while and have both made the playoffs more often than not in the past decade.  Last year was especially bad, when most of the playoff spots went to big market, big teams.  Great for playoff rankings, bad for most of the teams in the league.   The Yankees spent nearly SEVEN times as much in payroll entering 2010 than Pittsburgh; how can that be equitable?

Well, don’t look now but if the season ended today, as pointed out in this USAToday Article, only two of baseball’s top 10 salaried teams would qualify.  Most of baseball’s current 8 playoff teams are from middle-of-the-road payrolls.  There are two notable outliers: Texas comfortably currently sits atop the AL West with the 27th largest payroll and San Diego, with the 2nd LOWEST payroll in the majors, leads the NL west.  (See this google xls I put together briefly to show teams by record rank, playoff position and salary at the beginning of the season).

Each time a team like Tampa, San Diego or Texas competes well with the big boys, it makes it harder to implement some sort of reform.  Especially since you can look at each of the top tier payroll teams that are NOT in playoff contention right now and excuse their season.

  • #2. Boston: still have the 5thbest record and would be leading most any other division.  Lots of injuries, transition year away from expensive older vets like Ortiz and Lowell, $10M in dead money.  Theo keeps talking about a transition year; he’s biding his time before he can re-do the team in the image of the 04 and 07 teams.
  • #3: Cubs: over paid for Soriano, Zambrano underperforming, Fukodome bad signing.  Just not well constructed team.  Hendry on the GM hot seat.
  • #4: Philadelphia: great team, killed by injuries and inconsistent pitching.  You wonder how badly the Lee trade bungling will hurt them in years to come.  I still think they’ll overtake Atlanta, especially now that Chipper is done for the season.
  • #5: Mets: how does Minaya still have a job?  They seem to spend money because they have it, not because they acquire good players.  Oliver Perez, Jason Bay god awful signings, and just Santana and Beltran cost more than the San Diego Payroll annually.
  • #6: Tigers: you have to hand it to the Tigers owner, who purposely over spent b/c his town was so badly hurt in the economic crash.  But he has some very expensive players tied up (Cabrera, Verlander, Guillen) for a number of years and their role players aren’t good enough.  Dark Days ahead for Detroit.

So, the #1 payroll team has the best record and the #30 payroll team has the worst record.   But the teams in between aren’t acting like we expect.  Is this Moneyball re-incarnated?  Well no.  Billy Beane’s teams success in Oakland was less about his OBP-centric stats drafting and more about the three starting pitchers (ZitoHudson, Mulder) his teams were graced with (as pointed out in this excellent Buzz Bissinger article).  What it does point out is that good GMs (even the wealthy ones in NY and Boston) are starting to value the draft pick and the young player and are becoming better and better at drafting them.  San Diego and Texas both kept payroll low, traded away vets, accumulated draft picks.  Texas easily has the best farm system in the majors and now has a powerhouse team for very little money.  This is exactly the same blueprint practiced for years by Florida and Tampa, though Texas has shown they are not afraid to buy talent at the deadline (something the panhandle state teams never do and thus one of the reasons why neither team really has any appreciable fan following).

So, what should base ball do?

1. Should there be a salary cap?  Well, yes I think so.  I think the Yankees have a totally unfair player advantage over the rest of the league and it shouldn’t be possible to have 4 times the payroll of a team within  your own division.  But i have no idea how to implement it.

2. Should there be a salary floor?  Well, no.  Because teams like Texas, Florida, San Diego, Tampa and (in years past) Oakland have consistently shown that you can build great cheap teams by depending on player development, drafting and having an entire team of pre-arbitration or arbitration-eligible guys.  You can’t force a team to spend money just to achieve an arbitrary salary floor.  Plus you have to allow teams to blow things up and start over (essentially what Toronto is doing now) and try to build for the long run.

Nats Draft 2010 update

leave a comment

This is the Nats Farm authority draft tracker.  with the signing of their #3 and #8 round picks, the Nats have really locked in basically every non-marquee draft pick of their 2010 draft.  Who is left?

#1: Bryce Harper.  Thanks to Mr. Boras, don’t expect any movement until August 15th at 10:30pm.

#2: Sammy Solis, a Jr Lefty from USanDiego.  6’5″ 240 big lefty, #48 Baseball America prospect so perhaps a slight overdraft on our part at the top of the 2nd round.  Slight injury concern (ruptured disc in back cost him his sophmore season).  9-2, 3.00 era with 87/26 k/bb in 87ip.  Sits 89-92, touches 93.  Sounds kinda like a Detwiler with more bulk and thus less injury prone.

#4: AJ Cole; the most interesting of our draft picks.  Cole was a 1st round talent projected, signed with Miami.  He’s drawing comparisons to Justin Verlander in terms of his size/frame and his fastball (93-94, reportedly touching 98).  This is a great test of the ownership group; will they offer overslot money on a high-end talent?  Keith Law thinks its 50-60% that they sign him.

This would make for a pretty good drafting class if they get all three of these guys remaining.

They’ve already signed #3,5,6,7,10 positional players (all college juniors) and they’re all in Vermont playing short-A ball right now.

I was looking at the spreadsheet of draft picks and wonder though.  Why does any team bother drafting a High School kid in the 40th-50th round who has a division 1 college scholarship commit?  Is it just to impress the kid and make him feel good about himself?  I guess some of these guys pan out; 2006 we drafted Brad Peacock in the 41st round out of High School, probably gave him $1000 to sign, and he’s still plugging away.  He’s in Potomac now and isn’t doing too badly.

Written by Todd Boss

July 20th, 2010 at 2:52 pm