Nationals Arm Race

"… the reason you win or lose is darn near always the same – pitching.” — Earl Weaver

Stats Overview Part II: Hitting stats on the rise: wRC, wOBA, etc

2 comments

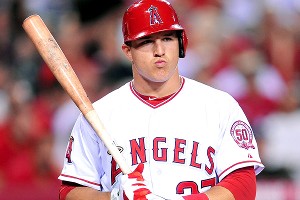
Trout's BABIP was very high in 2012; what does this mean for 2013? Photo Gary Vasquez/US Presswire via espn.com

(Part 2 in a series: Part 1 talked about Whats Wrong with Old School Baseball Stats).

More and more in modern baseball writing, you see relatively new statistical creations thrown into articles in order to prove or disprove an opinion, and more and more you almost need a glossary to properly read these articles and properly understand what the author is attempting to say.  I always want to understand that which I read, and at the same time I want to make sure I stay current and up-to-date on the stats out there, so I decided to do a little research (and pen my own post while I was at it) into some of these newer stats that are being used.

I’ll write about each stat, give links to its calculation, write about how it may be used, then put in some rules of thumb by which to consider the stat.

Pretty much every stat here is defined and available at either Baseball-reference.com or fangraphs.com.  BaseballProspectus.com also has some more obscure stats discussed further below.  I’ve always thought that B-R’s interface was so much easier to navigate that I tend to search there first, but a more complete set of stats is at fangraphs.

1. BABIP.  Batting Average on Balls in Play.  Most people know this one, but it is an important stat to consider in conjunction with other stats (especially the older Batting Average and Earned Run Average).   The calculation, as it is seen at Wikipedia, measures basically how many balls put into play (removing from consideration home runs) turned into hits.  Interestingly it penalizes the hitter for hitting sacrifice flies (not sure why).  This stat is kept for both individual hitters and for pitchers.

How is BABIP used? The measurement is essentially used as a checkpoint for fluky seasons.  If a pitcher has a very high ERA but also has a very high BABIP, one can explain that he’s been unlucky and his talent level lays somewhere below his posted performance on the year.  Ironically, the two leaders of Pitcher BABIP in 2012 were both on the Tigers; Rick Porcello and Max Scherzer had BABIPs of .344 and .333 respectively; this delta is probably going to lead to both of these guys having better ERAs in 2013.  If a hitter has a decent hitting season but also has a high BABIP, one usually says that the hitter was “lucky” and is due to regress (Mike Trout in 2012 had a Babip of .383.  That’s really high, probably unsustainably high, and he probably regresses statistically in 2013).

MLB Average/Rule of thumb: .290-.300 depending on the year.

When BABIP is high: a hitter is considered to be “lucky,” and future regression of more batted balls being turned into outs is expected.

When BABIP is low, a hitter is considered to be “unlucky,” and future improvement of more hits on batted balls is expected.

Caveats using BABIP: there are many arguments about whether some pitchers “baseline BABIP” should be modified based on their talent or capabilites.  For example, Mariano Rivera‘s career BABIP is .262 while R.A. Dickey‘s BABIP since he turned into a Mets knuckleballing starter is around .275.  Rivera’s lower baseline is probably attributed to his amazing cutter and his pure skill, while Dickey’s is most likely due to the fluctuations of hitting his knuckleball.  Meanwhile, some hitters maintain higher than average career BABIPs (two extreme examples that immediately come to mind are Ichiro Suzuki and Nyjer Morgan, with career BABIPs of .347 and .336 respectively.  Why so high?  Because both are skilled at bunting (or at least hitting choppy grounders) for base hits, artificially inflating their baseline BABIP.

2. ISO; Isolated Power.  As posted on Wiki, Isolated power can be simply calculated by subtracting a hitter’s batting average from the slugging percentage, or as it is more eloquently defined at FanGraphs, ISO is essentially a measure of how many extra base hits a batter hits per at-bat.  Slugging tells you how many bases per at bat a hitter obtains, but ISO strips out singles to isolate a player’s capability of hitting doubles, triples and homers.  Here’s a couple of decent examples from 2012; our own Bryce Harper hits a ton of extra base hits; he’s posted a .206 ISO for the 2012 season.  Meanwhile we know that the aforementioned Nyjer Morgan is not a very powerful hitter and ISO shows it; he’s at .069 for the 2012 season.  The league leaders for ISO reads like a list of MLB’s best sluggers.  Giancarlo Stanton would have led the league in ISO had he qualified; he posted a fantastic .318 ISO in 2012.

How is it used? ISO is used to measure how good a hitter is at getting extra-base hits.

MLB Average/Rule of thumb (from Fangraphs page) .145 is considered an “average” MLB ISO figure.  .200 is pretty good, .100 is poor.

Caveats using ISO: as with many sabremetric-tinged stats, small sample sizes greatly skew the figures.  Fangraphs says 550 ABs is needed before really drawing any judgements.

3. wOBA; Weighted On Base Average.  Created by Tom Tango, wOBA is a relatively newer statistic that attempts to improve upon the traditional batting statistics we use (Batting Average, Slugging and On Base Percentage) by measuring cumulative “weighted” hits that a batter may achieve.  It is based on the premise that the three traditional stats just mentioned all treat hitting events relatively the same.  Is a single equal to a double?  No, but in Batting Average it is.  Is a double worth half as much as a home-run?  No, but in the Slugging Percentage it is.  Each hitting event is weighted and added together, with increases/decreases for stolen bases/caught stealing thrown in, to arrive at a measurement that attempts to better quantify pure hitting.

How is it used?  wOBA attempts to be set to the same scale as the league wide OBP, which seems to hover around .315-.320 year to year.

MLB Average/Rule of thumb (from Fangraphs page) .320 is a good “league average” number.  .370 is great, .300 is poor.

Caveats using wOBA: There are several to keep in mind; the weights change  year to year, in order to normalize the stat across generations.  It is NOT normalized to park factors, so hitters in places like Boston and Colorado will have artificially inflated wOBAs to their true value.  Lastly, there’s zero context given to the game situation when measuring hits (i.e. was there a guy on third with one out?  Was it a close game in the 9th?)  I think particular situation is nearly impossible to measure in any stat, but it is important.

4. RC/wRC: Runs Created and Weighted Runs Created.  Runs Created is a stat that Bill James invented in one of his earlier Baseball Abstracts (1985) in order to try to measure simply how many runs an individual player contributed to the team in a given season.  It was improved upon vastly in 2002 to be much more detailed and accurate; the original version over-emphasized some factors of hitting.  It is a complicated statistic (see its wiki page for the formula).  The aforementioned Tom Tango improved upon the basic RC by creating the Weighted version of the statistic based on his own Weighted OBA statistic (which he believed more closely measures the proper “value” of each hitting event).

How is it used?  Individually, RC and wRC need to be understood in context of an entire season.  It isn’t until we get to wRC+ (see below) that a side-by-side comparison is capable.  Its like saying “Player X has 105 hits.”  If that’s through 75 games, that’s pretty good; if that’s for an entire season, well that’s pretty poor.

MLB Average/Rule of thumb (from Fangraphs page) RC and wRC both have roughly the same scales.  60 is average, 100 is great, 50 is poor for a full season.

Caveats using RC and wRC: They are basically full season counting numbers.  In 2012, Trout started in the minors, so his RC and wRC totals are less than his MVP competition Miguel Cabrera.

5. wRC+/wRAA: Weighted Runs Created Plus/Weighted Runs Above Average

wRAA and especially wRC+ are touted by fangraphs.com as being very good “single number” statistics to properly measure a player’s hitting ability.  I often use OPS+ as a singular number to measure a hitter; fangraphs specifically calls out this number and recommends using wRC+.

How is it used?  Both numbers basically measure the same thing.  wRC+ is a bit easier to explain; 100 is the league baseline, and points above or below the average are expressed as “percentage points above or below the league average.”  So, a person with a 120 wRC+ is considered to be 20% better at creating runs than the average major leaguer.  Cabrera and Trout ironically tied for the MLB lead for 2012 in wRC+, each posting a 166 wRC+.  Meanwhile wRAA (per fangraphs.com) “measures the number of offensive runs a player contributes to their team compared to the average player” and is scaled to zero.  wRAA is essentially a direct calculation from wOBA, so if you’re using one you can likely ignore the other.

MLB Average/Rule of thumb (from Fangraphs page) for wRC+: 100 is average while for wRAA zero (0) is average.  20-25 percentage points above is great, while 15-20 percentage points below is bad.

Caveats for using: Unlike wOBA, wRC+ is park- and league-adjusted, indeed making it an excellent single number by which to measure players.  Otherwise the caveats for these weighted averages are all about the same; they seem to be based on an weighting of hits that you may or may not agree with.


What have I learned from looking into these hitting stats?  I need to keep BABIP in mind.  I like ISO but I don’t see it gaining real credence over slugging percentage.  And I should probably start using wRC+ more than OPS+.

Part 3 coming up on Pitching advanced stats.

Cal Ripken Burgers??

leave a comment

I'm sure they're really tasty. Photo unknown via baltimoresports.report.com

Because when I think of frozen burger patties, I think of Cal Ripken Jr.

I was shopping at Giant over the weekend and did a double-take in the frozen food aisle.  Did you guys know that Ripken is hawking a line of burgers?  I didn’t.  A bit of google work shows that they’ve been on the market since May of 2012.

Is it just me, or is this a relatively random athlete-food connection?  This would be like Reggie Jackson having his own candy bar.  Oh wait… 🙂

Written by Todd Boss

February 3rd, 2013 at 2:34 pm

Stats Discussion Part I: What’s wrong with Wins and RBI?

15 comments

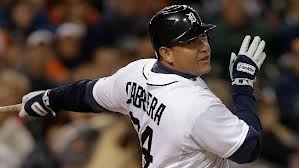
Cabrera's MVP award was thought to be on the backs of "bad stats." Is this a bad thing in general? Photo AP via sportingnews.com

(First Article in a series discussing Baseball Statistics that I mostly wrote months ago and was waiting for downtime to post.  As it happens, the posts that I have in the can for months on end tend to get rather bloated; this one is > 3000 words.  Apologies in advance if you think that’s, well, excessive).

(Note: a good starting point/inspiration for this series was a post from February 2012 on ESPN-W by Amanda Rykoff, discussing some of the stats used in the movie Moneyball.  Some of the stats we’re discussing in the next few posts are covered in her article).

The more you read modern baseball writing, the more frequently you see the inclusion of “modern” baseball statistics interspersed in sentences, without definition or explanation, which are thus used to prove whatever point the writer is making.   Thus, more and more you need a glossary in order to read the more Sabr-tinged articles out there.  At the same time, these same writers are hounding the “conventional” statistics that have defined the sport for its first 100 years and patently ridiculing those writers that dare use statistics like the RBI and (especially as of late) the pitcher Win in order to state an opinion.  This is an important trend change in Baseball, since these modern statistics more and more are used by writers to vote upon year ending (and career defining) awards, and as these writers mature they pour into the BBWAA ranks who vote upon the ultimate “award” in the sport; enshrinement into the Hall of Fame.

This year’s AL MVP race largely came down to the issue of writers using “old-school” stats to value a player (favoring Miguel Cabrera and his triple-crown exploits) versus “new-school” stats to value a player (favoring Mike Trout, who may not have as many counting stats but has put in a historical season in terms of WAR).  And as we saw, the debate was loud, less-than-cordial, and merely is exacerbating a growing divide between older and newer writers.  This same argument is now seen in the Hall of Fame voting, and has gotten so derisive that there are now writers who are refusing to vote for anyone but their old-school stat driven pet candidates as a petulant reaction to new-school writers who can’t see the forest for the trees in some senses.

A good number of the stats that have defined baseball for the past 100 years are still considered “ok,” within context.  Any of the “counting stats” in the sport say what they say; how many X’s did player N hit in a season?  Adam Dunn hit 41 homers in 2012, good for 5th in the league.  That’s great; without context you’d say he’s having a good, powerful season.  However you look deeper and realize he hit .204, he didn’t even slug .500 with all these homers and he struck out at more than a 40% clip of his plate appearances.  And then you understand that perhaps home-runs by themselves aren’t the best indicators of a player’s value or a status of his season.

Lets start this series of posts with this topic:

What’s wrong with the “old school” baseball stats?

Most old school stats are “counting” stats, and they are what they are.  So we won’t talk about things like R, H, 2B, 3B, HR, BB, K, SB/CS.  There’s context when you look at some these numbers combined together, or if you look at these numbers divided by games or at-bats (to get a feel for how often a player hits a home run or steals a base or strikes out a guy).  In fact, K/9, BB/9 and K/BB ratios are some of my favorite quick evaluator statistics to use, especially when looking at minor league arms.  But there are some specific complaints about a few of the very well known stats out there.  Lets discuss.

1. Runs Batted In (RBI).   Or as some Sabr-critics now say it, “Really Bad Stat.”   The criticism of the RBI is well summarized at its Wiki page; it is perceived more as a measure of the quality of the lineup directly preceeding a hitter than it is a measure of the value of the hitter himself.  If you have a bunch of high OBP guys hitting in front of you, you’re going to get more RBIs no matter what you do yourself.  Another criticism of the stat is stated slightly differently; a hitter also benefits directly from his positioning in the lineup.  A #5 hitter hitting behind a powerful #4 hitter will have fewer RBI opportunities (in theory), since the #4 hitter should be cleaning up (no pun intended) the base-runners with power shots.  Likewise, a lead-off hitter absolutely has fewer RBI opportunitites than anyone else on the team; he leads-off games with nobody on base, and hits behind the weakest two hitters in the lineup every other time to bat.

I’m not going to vehemently argue for the RBI (the points above are inarguable).  But I will say this; statistical people may not place value on the RBI, but players absolutely do.  Buster Olney touched on this with an interesting piece in September that basically confirms this;  if you ask major leaguers whether RBIs are important you’ll get an across-the-board affirmative.  Guys get on base all the time; there’s absolutely skill and value involved in driving runners home.  Guy on 3rd with one out?  You hit a fly ball or a purposefully hit grounder to 2nd base and you drive in that run.  Players absolutely modify the way that they swing in these situations in order to drive in that run.  And thus RBI is really the only way you can account for such a situation.  The Runs Created statistics (the original RC plus the wRC stats) don’t account for this type of situation at all; it only measures based on hits and at-bats.

(As a side-effect, the statistic Ground-into Double Plays has a similar limitation to RBI: it really just measures how many batters were ahead of you on base as opposed to a hitter’s ability to avoid hitting into them.  But thankfully GIDP isn’t widely used anywhere).

2. Batting Average (BA): The isolated Batting Average is considered a “limited” stat because it measures a very broad hitting capability without giving much context to what that hitter is contributing to the end goal (that being to score runs).  A single is treated the same as a home run in batting average, despite there being a huge difference between these two “hits” in terms of creating runs.  This is exemplified as follows: would you rather have a .330 hitter who had zero home runs on the season, or a .270 hitter who hit 30 home runs?   Absolutely the latter; he’s scoring more runs himself, he’s driving in more runs for the team, and most likely by virtue of his power-capability he’s drawing more walks than the slap hitting .330 hitter.  More properly stated, the latter hitter in this scenario is likely to be “creating more runs” for his team.

Statistical studiers of the game learned this limitation early on, and thus created two statistics that need to go hand in hand with the Batting Average; the On-Base Percentage (OBP) and the Slugging Percentage (SLG). This is why you almost always see the “slash line” represented for hitters; to provide this context.  But, be careful REPLACING the batting average with these two numbers (or the OPS figure, which represents On-Base percentage + Slugging).  Why?  Because Batting Average usually comprises about 80% of a players On base percentage.  Even the highest walk guys (guys like Adam Dunn or Joey Votto) only have their walk totals comprising 17-18% of their OBP.  If you sort the league by OBP and then sort it by BA, the league leaders are almost always the same (albeit slightly jumbled).  So the lesson is thus; if someone says that “Batting Average is a bad stat” but then says that “OBP is a good stat,” I’d question their logic.

Lots of people like to use the statistic OPS (OBP+SLG) as a quick, shorthand way of combing all of these stats.  The caveat to this is thus; is a “point” of on-base percentage equal to a “point” of slugging?  No, it is not; the slugging On Base Percentage point is worth more because of what it represents.  Per the correction provided in the comments, 1.7 times more.

Coincidentally, all of the limitations of BA are attempted to be fixed in the wOBA, which we’ll discuss in part 2 of this series.

3. ERA: Earned Run Average.  Most baseball fans know how to calculate ERA (earned runs per 9 innings divided by innings pitched), and regularly refer to it when talking about pitchers.  So what’s wrong with ERA?

Specifically, ERA has trouble with situations involving inherited runners.  If a starter leaves a couple guys on base and a reliever allows them to score, two things happen:

  • those runs are charged to the starter, artifically inflating his ERA after he’s left the game.
  • those runs are NOT charged to the reliever, which artificially lowers his ERA despite his giving up hits that lead to runs.

ERA is also very ball park and defense dependent; if you pitch in a hitter’s park (Coors, Fenway, etc) your ERA is inflated versus those who pitch in pitcher parks (Petco, ATT).  Lastly, a poor defense will lead to higher ERAs just by virtue of balls that normally would be turned into outs becoming hits that lead to more runs.  Both these issues are addressed in “fielder independent” pitching stats (namely FIP), which are discussed in part III of this series.

A lesser issue with ERA is the fact that it is so era-dependent.  League Average ERAs started incredibly high in the game’s origin, then plummetted during the dead ball era, rose through the 40s and 50s, bottomed out in the late 60s, rose slightly and then exponentially during the PED era and now are falling again as more emphasis is placed on power arms and small-ball.  So how do you compare pitchers of different eras?  The ERA+ statistic is great for this; it measures a pitcher’s ERA indexed to his peers; a pitcher with an 110 ERA+ means that his ERA was roughly 10% better than the league average that particular year.

4. Pitcher Wins.  The much maligned “Win” statistic’s limitations are pretty obvious to most baseball fans and can be stated relatively simply; the guy who gets the “Win” is not always the guy who most deserves it.  We’ve all seen games where a pitcher goes 7 strong innings but his offense gives him no runs, only to have some reliever throw a 1/3 of an inning and get the Win.  Meanwhile, pitchers get wins all the time when they’ve pitched relatively poorly but their offense explodes and gives the starter a big lead that he can’t squander.

Those two sentences are the essence of the issue with Wins; to win a baseball game requires both pitching AND offense, and a pitcher can only control one of them (and his “control” of the game is lost as soon as the ball enters play; he is dependent on his defense to get a large majority of his outs, usually 60% or more even for a big strike out pitcher).  So what value does a statistic have that only measures less than 50% of a game’s outcome?

The caveat to Wins is that, over the long run of a player’s career, the lucky wins and unlucky loseses usually average out.  One year a guy may have a .500 record but pitch great, the next year he may go 18-3 despite an ERA in the mid 4.00s.  I have to admit; I still think a “20-game winner” is exciting, and I still think 300 wins is a great hall-of-fame benchmark.  Why?  Because by and large wins do end up mirroring a pitcher’s performance over the course of a year or a career.  The downside is; with today’s advances in pitcher metrics (to be discussed in part III of this series), we no longer have to depend on such an inaccurate statistic to determine how “good” a pitcher is.

Luckily the de-emphasis of Wins has entered the mainstream, and writers (especially those who vote for the end-of-year awards) have begun to understand that a 20-game winner may not necessarily be the best pitcher that year.  This was completely evident in 2010, when Felix Hernandez won the Cy Young award despite going just 13-12 for his team.  His 2010 game log is amazing: Six times he pitched 7 or more innings and gave up 1 or fewer runs and got a No Decision, and in nearly half his starts he still had a “quality start” (which we’ll talk about below briefly).  A more recent example is Cliff Lee‘s 2012 performance, where he didn’t get a win until July, getting 8 no-decisions and 5 losses in his first 13 starts.  For the year he finished 6-9 with a 3.16 ERA and a 127 ERA+.  Clearly Lee is a better pitcher than his W/L record indicates.

(Coincidentally, I did a study to try to “fix” pitcher wins by assigning the Win to the pitcher who had the greatest Win Percentage Added (WPA).  But about 10 games into this analysis I found a game in April of 2012 that made so little sense in terms of the WPA figures assigned that I gave up.  We’ll talk about WPA in part 4 of this series when talking about WAR, VORP and other player valuation stats).

5. Quality Starts (QS) Quality Starts aren’t exactly a long standing traditional stat, but I bring them up because of the ubiquitous nature of the statistic.  It is defined simply as a start by a pitcher who pitches 6 or more innings and who gives up 3 or less earned runs.   But immediately we see some issues:

  1. 6 IP and 3 ER is a 4.50 ERA, not entirely a “quality” ERA for a starter.  In fact, a starter with a 4.50 ERA in 2012 would rank  him 74th out of 92 qualified starters.
  2. If a pitcher pitches 8 or 9 complete innings but gives up a 4th earned run, he does not get credit for the quality start by virtue of giving up the extra run, despite (in the case of a 9ip complete game giving up 4 earned runs) the possibility of actually having a BETTER single game ERA than the QS statistic defaults to.

Why bring up QS at all?  Because ironically, despite the limitations of the statistic, a quality start is a pretty decent indicator of a pitcher’s performance in larger sample sizes.  Believe it or not, most of the time a quality start occurs, the pitcher (and the team) gets the win.  Take our own Gio Gonzalez in 2012; he had 32 starts and had 22 quality starts.  His record? 21-8.  Why does it work out this way?  Because most pitchers, when you look at their splits in Wins versus Losses, have lights out stuff in wins and get bombed during losses.  Gonzalez’s ERA in wins, losses and no-decisions (in order): 2.03, 5.00 and 4.32.  And, in the long run, most offenses, if they score 5 or more runs, get wins.  So your starter gives up 3 or fewer runs, hands things over to a bullpen that keeps the game close, your offense averages 4 runs and change … and it adds up to a win.

I used to keep track of what I called “Real Quality Starts (rQS)” which I defined as 6 or more IP with 2 or fewer earned runs, with allowances for a third earned run if the pitcher pitched anything beyond the 6 full innings.  But in the end, for all the reasons mentioned in the previous paragraph, this wasn’t worth the effort because by and large a QS and a rQS both usually ended up with a Win.

6. Holds: A “hold” has a very similar definition as the Save, and thus has the same limitations as the Save (discussed in a moment).  There was a game earlier this season that most highlights the issues with holds, as discussed in this 9/21/12 post on the blog Hardball Times.  Simply put; a reliever can pitch pretty poorly but still “earn” a hold.

Holds were created as a counting stat in the mid 1980s in order to have some way to measure the effectiveness of middle relievers.  Closers have saves, but middle-relief guys had nothing.  The problem is; the hold is a pretty bad statistic.  It has most of the issues of the Save, which we’ll dive into last.

7. Saves. I have “saved” the most preposterous statistic for last; the Save.  The definition of a Save includes 3 conditions that a reliever must meet; He finishes a game but is not the winning pitcher, gets at least one out, and meets certain criteria in terms of how close the game is or how long he pitches.  The problem is that the typical “save situation” is not really that taxing on the reliever; what pitcher can’t manage to protect a 3 run lead when given the ball at the top of the ninth inning?  You can give up 2 runs, still finish the game, have a projected ERA of 18.00 for the outing and still get the save.  Ridiculous.  And that’s nothing compared to the odd situation where a reliever can pitch the final 3 innings of a game, irrespective of the score, and still earn a save.  In the biggest blow-out win of the last 30 years or so (the Texas 30-3 win over Baltimore in 2007), Texas reliever Wes Littleton got a save.  Check out the box score.

I wrote at length about the issue with Saves in this space in March of 2011, and Joe Posnanski wrote the defining piece criticising Saves and the use of closers in November 2010.  Posnanski’s piece is fascinating; my biggest takeaway from it is that teams are historically winning games at the exact same rate now (with specialized setup men and closers) that they were winning in the 1950s (where you had starters and mop-up guys).

I think perhaps the most ridiculous side effect of the Save is how engrained in baseball management it has become.  Relievers absolutely want Saves because they’re valued as counting numbers they can utilize at arbitration and free agency hearings to command more salary (I touched on in a blog post about playing golf with Tyler Clippard this fall; he absolutely wanted to be the closer because it means more money for him in arbitration).  Meanwhile, there are managers out there who inexplicably leave their closer (often their best reliever, certainly their highest paid) out of tie games in late innings because … wait for it … its not a save situation.  How ridiculous is it that a statistic now alters the way some managers handle their bullpens?

What is the solution?  I think there’s absolutely value in trying to measure a high leverage relief situation, a “true save” or a “hard save.”  Just off the top of my head, i’d define the rules as this:

  • there can only be a one-run lead if the reliever enters at the top of an inning
  • if the reliever enters in the middle of an inning, the tying run has to at least be on base.
  • the reliever cannot give up a run or allow an inherited run to score.

Now THAT would be a save.  Per the wikipedia page on the Save, Rolaids started tracking a “tough save” back in 2000, and uses it to help award its “Fireman of the Year” award, but searching online shows that the stats are out of date (they’re dated 9/29/11, indicating that either they only calculate the Tough Saves annually, or they’ve stopped doing it.  Most likely the former frankly).


Phew.  With so many limitations of the stats that have defined Baseball for more than a century, its no surprise that a stat-wave has occurred in our sport.  Smart people looking for better ways to measure pitchers and batters and players.

Next up is a look at some of the new-fangled hitting stats we see mentioned in a lot of modern baseball writing.

Trevor Bauer video of pitch grips

2 comments

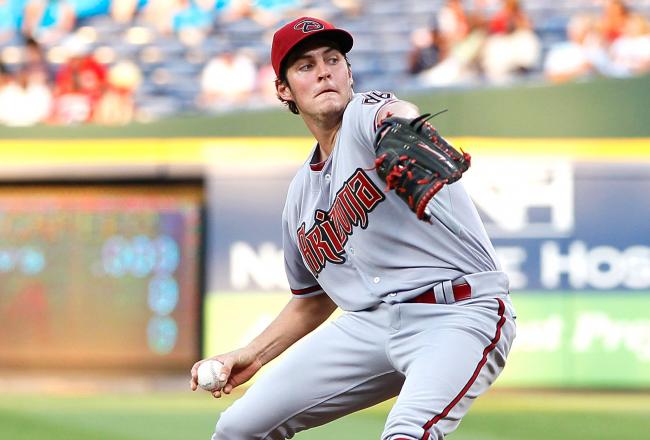
Pitching phenom Trevor Bauer demonstrates his pitching grips. Photo Kevin C. Cox/Getty Images via bleacherreport.com

Fascinating stuff here (link on youtube but referenced via the HardBallTalk blog).

I know I criticized Trevor Bauer in the wake of Arizona trading him away for what seemed to be personality issues.  But in hindsight, with the knowledge now that the team also traded Chris Young and now Justin Upton for apparently all the same reasons (manager Kirk Gibson didn’t like them, or didn’t like the way they played), at some point you have to start looking at the manager who can’t get along with star players versus the reverse.

But stuff like this video really makes me like the kid.  He posted this video showing how he grips and throws all his pitches in response to questions he got from regular fans.  He also freely gives out his facebook and twitter contact information and promises to try to get back to fans who ask questions.  I love social media sometimes.

Bauer’s pitch grips and thoughts:

  • Four Seam Fastball: conventional grip, nothing special.  He doesn’t mention throwing a 2-seam fastball other than mentioning the pitch in passing later on, but with his velocity and his throwing motion (straight over the top) you’d have to think a 2-seamer would be effective.
  • Regular Changeup: not a palm-ball, but a de-acceleration technique by throwing the ball off his middle fingers.
  • “Cut” Changeup; moves his index finger up and provides a bit of pressure; this apparently causes the ball to “cut” 2-3 inches.
  • Cutter; he calls it his “regular slider,” but its an odd grip for a slider; it looks more like a 2-seam fastball grip.  He admits it moves more like a cutter, so that’s what I’ve called it.  He seems to fix his wrist slightly askew, then go through a fastball motion and the ball cuts.
  • Slider: This is a much more conventional slider grip and throwing motion.  He calls it a “dot” slider (likely because the seams form a dot on the spinning baseball) and says that its rather “slurvy,” probably because (unlike his curve) it moves across his body.
  • Reverse Slider: He uses the same cutter grip but fixes his wrist in and then comes through the ball with a screw-ball motion.  He says he gets 4-6 inches of reverse movement.  Man that’s a lot of movement if its true.  Mariano Rivera only gets about 7-8″ of movement on what is generally the best cutter in the game.
  • Curve: he throws 2 variations depending on whether he’s looking to control it for strikes or to really break it off as an out pitch.  He varies the pressure of his middle finger; less on the tip for lesser movement/more control and then more on the tip for more movement/sharper break.  He doesn’t seem to snap his wrist in the same way that a 3/4 pitcher would (basically where the wrist snaps towards the opposite side of the body); he snaps his wrist straight down towards the ground.   This should result in close to a 12-to-6 curve that is relatively rare in the majors.  I would have thought this meant less spin, but I’d also guess that with enough wrist strength and repeitition,  you’d get the spin you need.
  • Split Fingered fastball: he definitely throws this like Roger Clemens or Mike Scott, where the ball isn’t jammed back into the hand like a forkball, but instead is more like a fastball brip with spread fingers.   He doesn’t throw this much, but it makes sense for an over-the-top guy to throw this.  (I often said that Brad Peacock needed to learn this same pitch).

He also talks a lot about the way he fixes his wrist on pitches (changeups and sliders) and brings his arm through.  I wonder; is that conventional?  I’ve never given thought to the position of my own wrist when I have pitched in the past.

So, that’s 8 specific pitches, perhaps 9 if you count a 2 seam fastball in there.  And there’s no circle change or knuckle curve.   How do you call a game with this guy?

His pitch f/x data is limited from 2012; they only have 169 pitches classified.  They have him throwing 4 differerent pitches (FB, CU, CH, SL) at speeds that generally are lower than his scouting reports have him throwing (FB average velocity 92.2 with a 95.1 max).  I’m hoping he gets a shot in 2013 to really show his repetoire.  I’d like to see what he can do in the majors.

Written by Todd Boss

January 31st, 2013 at 9:50 am

Gonzalez linked with PED-clinic; are we worried?

22 comments

Gio Gonzalez may be in a bit of trouble. Photo Joy Absalon/US Presswire via usatoday.com

As announced early on January 29th, 2013, an anti-aging clinic in Miami run by Anthony Bosch has been accused of being a PED factory and the Miami New Times has published an extensive report after reviewing documents, spreadsheets and hand-written customer notes that were obtained by the newspaper from a former employee.

The relevance to the Nationals?  Gio Gonzalez appears in the documentation multiple times, along with his father.  And while the evidence directly linking Gonzalez to specific orders for HGH, Testosterone or Anabolic steroids is non-existant (unless the code “1.c.1 with Zinc/MIC” can be proven to mean a banned substance), generally speaking where there’s smoke, there’s fire with respect to PEDs and baseball players these days.  In James Wagner‘s WP article today on the topic, he found a doctor who speculated that MIC may stand for a combination of three compounds that are used frequently in weight loss routines, and definitely NOT illegal.

Even if Gonzalez is completely innocent, this report automatically besmirches his career.  Which is either a shame or will be justice.  Time will tell.  At least there doesn’t seem to be direct, provable evidence that Gonzalez (or his relations) purchased illegal products, a small light for Nats fans at the end of this particular tunnel.

Of immediate importance to the team; is this going to lead to a suspension?  Doubtful, based on evidence seen so far.  But certainly this should give players pause; what is the reputation of the clinics that I use?  Tom Verducci‘s immediate reaction is that this is a “severe” incident and notes that the new CBA allows suspensions even without positive tests.

The bigger scalp of course belongs to Alex Rodriguez, who the evidence seems to show bought HGH as recently as 2012.   *sigh*   He’s stated that he quit PEDs in 2003.  The report makes him look really, really bad.  For the slugger, at this point in his career and with the statements he’s already made on PED usage, to get caught again would be nothing short of amazing to me (he’s denied it, of course).  The arrogance and stupidity of his getting caught again would be the absolute nail in his public relations coffin.   At least the career HR record that Rodriguez once seems an absolute shoe-in to capture now seems safe; he likely misses most of his season with hip surgery (his age 37 year) and he’s averaged just 110 games and 17 homers the last two seasons.   The likelihood of his hitting 116 more home runs at this point seems nil.  I’m not going to go as far as some national writers though, who are saying they think Rodriguez’s career is over (David Schoenfield in particular).

Some pundits are already predicting that this will be the next Balco.  I think i’ve got PED fatigue.

Written by Todd Boss

January 30th, 2013 at 9:53 am

Ladson’s inbox 1/28/13

13 comments

Espinosa's shoulder injury is the big news this week. Photo AP Photo/Nick Wass

These Inboxes are coming fast and furious!  Its almost like we’re just a few days away from Pitchers and Catchers reporting or something.  I should do an inbox response.  Except nobody emails me any questions.   Sometimes I wonder who emails Bill Ladson some of these questions, frankly, especially the people who keep asking about who the manager will be in 2014.  Anyway, here’s his 1/28/13 inbox and how i’d have responded.

Q: What is the status of Chris Marrero? Does he figure to contribute in the Major Leagues at all this year?

A: The phrase “what have you done for me lately” never seems more appropriate than when talking about Chris Marrero.   In November 2007 he was listed by Baseball America as our #1 prospect.   #1 over the likes of Detwiler, Zimmermann, Maxwell, Clippard, Desmond, Peacock, Norris and even Bernadina.    A season-ending injury in 2008, slow progress up our system and then last off-season’s torn hamstring have now dropped him to the Nats #23 ranked prospect overall.  #23 puts him behind “prospects” such as Corey Brown and right above 7-year minor leaguer Carlos Rivero.

The status of Marrero is this: he’s stuck at first-base, seemingly can’t play anywhere else, but doesn’t hit nearly enough homers in order to be a MLB first baseman.  So he seems sort of in a quandry.  Unless he suddenly turns into a 30-home run hitter over-night, or figures out how to play another position, he’s really in a tough spot.  On the Nats depth chart at 1B, he seems to be no better than 4th right now (LaRoche, Moore, Tracy).  That doesn’t bode well for him contributing at the MLB level.  It seems to me that the only way he’s playing meaningful minutes at first this year is if both LaRoche and Moore come down with season-ending injuries.

On the bright side; despite us hearing about him for years, he’s only 24.  But he’s running out of time.  He’ll burn his 3rd and last option in 2013 and isn’t going to be eligible for a 4th.  Marrero needs to hit lights out in AAA this year, get an injury on the big club and gets some big-league ABs, and build trade value.

Ladson has answered this question before and repeated his answer; he thinks Marrero needs to be traded.  Great idea!  Now, who exactly is going to trade for him right now?  And what exactly could the Nats get in return?  These sort of things matter when looking at trade candidates and it irritates me when they’re not taken into consideration by supposed “professionals” in the field.

Q: Given Danny Espinosa’s torn rotor cuff and disappointing second half last season, is there any chance Steve Lombardozzi will become the Opening Day starting second baseman?

A: Boy, the revelation that Danny Espinosa has a torn rotator cuff is big news to me.  Even though its in his non-throwing shoulder (obviously; if it was in his right shoulder he’d likely have had the surgery as soon as it happened), you have to think this affects his hitting.  In fact, the blog Nationals Review did just this yesterday in a great bit of analysis: before the estimated injury date Espinosa was hitting 255/.321/.416.  Afterwards (including his awful playoffs): .156/.241/.234.  That’s rather definitive, even if “after injury” only included a few weeks of the regular season and a 5-game series.

I think the injury gives the team a built-in excuse to replace him if he starts off the year struggling.  Opening Day though?  No way; Davey Johnson is a players’ manager, is old-school and will go with the team at hand unless someone gets hurt in Viera.  Ladson says lets see what happens in Spring Training.  I think that’s the baseball writer equivalent of an Economist saying, “It depends.”

Q: Do you think Johnson will sit Espinosa more often this season because of his injury?

A: Doubtful; he’s either going to produce or not.  If he doesn’t produce, look for him to be sent to the DL for surgery.  I don’t see him getting sat sporadically.  Ladson says that Espinosa won’t let that happen.  Last time I checked though, Espinosa was the player and Johnson was the manager.  So I’m not sure how he can make that command decision.

Q: What role do you foresee Christian Garcia playing this year?

A: I see Christian Garcia starting the year as a starter in AAA and then one of two things happening; either he hurts himself again, thus destroying the whole starter experiment.  Or, someone in the MLB bullpen gets hurt or gets ineffective (ahem, Henry Rodriguez anyone?) and Garcia-as-starter is scrapped as he’s brought up to pitch meaningful innings.  Ladson says he expects Garcia to be a bullpen member and doesn’t buy into the starter experiment.

Q: Assuming 2013 is Johnson’s final year, do you think his replacement will come from inside or outside the organization?

A: I just don’t get how people are obsessing over the 2014 manager.  Call me when the World Series is over and AFTER Johnson actually retires.  Ladson predicts someone from within.

Q: After Adam LaRoche’s contract runs out, could Ryan Zimmerman move across the diamond to first base and let Anthony Rendon play third?

A: This is exactly what I believe should happen.  My ideal world has Rendon hitting his way into a utility infielder role this year, pushing for more playing time next year (perhaps even forcing the Nats hand at 2nd base), and Zimmerman logically moving across the diamond to alleviate his mental issues with routine throws and to protect his body from the constant pounding he gets at 3rd.  Ladson wants Zimmerman at 3rd for a long time, apparently forgetting that Zimmerman increasingly has difficulty making routine throws and being incredibly fragile.

Q: What are the chances of the Nats opening the season with Bryce Harper in right field and Jayson Werth in left?

A: Zero.  But, honestly, Werth in left is a better defensive team.  Harper‘s so good in center while Werth‘s range is eroding in right, it just makes more sense to switch them up.  Why won’t it happen on opening day?  Deference to the veteran.  Deference to the contract.  I expect the OFs to switch around and get each of them playing time in all three positions.  Ladson says that Harper is more comfortable in left while Werth is an “above-average” right fielder.  Uh, not according to UZR/150, which had Werth at a very poor -14.2 in 2012.  Harper belongs in RF but it won’t happen overnight.

William Taft??

6 comments

Is William Taft a more random choice for the 5th racing president?  Who here, prior to today, would have even named Taft as a short-list candidate?

Aside from the fact that, last time I checked, there was still only four presidents on Mt. Rushmore, did we really need a 5th racing president?  Does this mean we’ll be introducing a new president every few years from now on?  Does this mean that eventually we’ll have a dozen charicatures of former statesman “racing” to the finish line (inexplicably greeted by a giant felt Lizard, to pay homage to the ever present commercialism rampant in today’s game)?

I will say that after reading Dan Steinberg‘s article in the Saturday Washington Post, that I understand the selection a bit more.  I fully admit that I had no recollection of Taft’s presidency in general, nor did I remember that he and Teddy Roosevelt had a massive argument (which of course is now ripe for mocking during every race), nor that Taft is apparently responsible for both throwing out the first pitch and (by urban legend) establishing the 7th inning stretch.  I’m a bit more on-board now.

However, had I known that making a change was in the works, I think I would have gone in a different direction.  I would have either selected arguably the last remaining inarguable “great” president this country has had (Franklin Roosevelt), or I would have dumped all four of our existing presidents and simply created characatures of the last four sitting presidents to do the racing.  Imagine a race with Barack Obama, the  younger George W. Bush, Bill Clinton and the older George Bush.  How funny could that be?  On a nightly basis you could have each president’s predecessor messing with his successor, or you could play off of each president’s nuances.  There’s equal balance between Republicans and Democrats here, and I’m sure that W. wouldn’t mind being the “Teddy Roosevelt” lovable loser of the group 🙂

Written by Todd Boss

January 26th, 2013 at 9:33 am

Verducci effect for 2013 announced

8 comments

Verducci predicts Nats fans may be reliving this ugly moment. Photo credit unknown.

SI sportswriter Tom Verducci published his 2013 iteration of the “Verducci Effect” article this week, and our own Stephen Strasburg is on his watch list.

The questions we’ll address in this article are these: Should we be worried as Nats fans about Strasburg?  And, do you even believe in the Verducci effect?

Cutting and pasting from his article, here’s the Verducci Effect defined (or the “Year-After Effect” as he calls it, so as humbly not to refer to the theory by his own name as the rest of us do):

The Year-After Effect, as I called the risk after a big innings jumps, is not a scientific, predictive system. It’s a rule of thumb to identify pitchers who may be at risk because of a sharp increase in workload. The older the pitcher, the bigger the body type and the closer to the 30-inning threshold is their increase, the less they seem to be at risk.

Of importance here is his own admission; this is a “rule of thumb,” not a scientific analysis, he limits his candidates to pitchers age 25 or younger, and he picks players instead of doing an across-the-board analysis of all eligible players (this is important as we talk about whether the effect is statistically supported).  He identified 14 such players in his 2012 iteration of this analysis and 9 of them suffered injuries or “significant regression.”  He has a similar track record in his previous years; of the 69 pitchers he’s identified in the last 7 years as being at risk, 55 of them have now suffered injury/posted significantly worse ERAs.  That’s about an 80% succeessful prediction clip.

Strasburg pitched 68 MLB innings and another 55 1/3 in the minors for a total of 123 1/3 2010 innings.  He threw 159 1/3 in 2012, for a total increase of 36 innings from his previous professional high, or a 22.6% increase.  Generally speaking Verducci’s threshold is in the 15-20% range.  Strasburg isn’t the most “at-risk” pitcher on the list; that would be Chicago’s Chris Sale, who amazingly threw 121 more innings in 2012 than he ever had before, being converted from the bullpen to a starter last year.   But Strasburg definitely increased his workload in 2012, and he’s likely to be increasing it again in 2013, with no stated limit on innings for the coming season.  If he averages the same number of innings per start this year as he did last year (5.69) he’ll end up with roughly 187 2/3 innings in 2013, which would be another 15% increase over his previous career high.  Most likely we’ll see him averaging closer to 6ip per outing, which would put him at about 200 innings and representing another 20% increase in innings.

Do we think this is dangerous territory?  Should we be worried?  All signs point to “No;” there’s not a person in the baseball world who would claim that the Nats have been anything but ultra-conservative with Strasburg since the moment he was signed.  His surgery, his recovery, and especially the heavily criticized “shut-down” in September of last year.  The team chose to be less competitive in the short term in order to attempt to be a better, stronger team in the long term.  Given his gradual ramping up of innings and his carefully managed recovery, I expect to see a similar season that Jordan Zimmermann just gave, two years removed from the same surgery.  No injuries, a strong season but with some evident fatigue at season’s end.


A better question may be this: does the Verducci effect actually exist?

This January 2012 Deadspin.com article pretty nicely summarizes all the criticisms associated with the effect.  A few more links are in this article at AmazingAvenue.  This study done by The Hardball Times that looked at ALL pitchers age 25 or younger, divided the pitchers into two groups (those who did and did not throw 30 more innings and thus usually qualify for Verducci analysis) and studied the results.    They found that the overall performance didn’t seem to be different between the two groups.

So, if the effect doesn’t exist, why does Verducci have an 80% prediction success rate?  If the statistical differences between the two groups are identical, then why isn’t Verducci’s prediction rate closer to 50%?

The answer lies in the following statement: Verducci’s articles don’t present themselves to be a macro statistical analysis, and they doesn’t approach the problem in the same way that statisticians do.  Instead, he finds candidates that qualify and then passes judgement based on his professional opinion about whether they’re a “watch candidate.”  Which I think is a perfectly fine way to do an analysis piece like this.  Of the 11 pitchers he selected this year, 4 are from 2012 playoff teams, another 2 are from teams in the ultra-competitive AL East, and 2 more experienced such extremely high jumps in innings that even a non-statistical observation would conclude they’re injury risks for 2013.  I don’t think this kind of analysis is unreasonable frankly.  He clearly “cherry picked” these candidates but for good reason; they were for the most part either severely driven or were pitching a lot of higher-than-average leverage innings for the bulk of the year, all the while throwing deeper into seasons than ever before.

Its a combination of statistics and opinion; most critics of the theory use 100% statistics to claim that the effect doesn’t exist.  But that’s the rub that I keep coming back to when talking about the use of statistics in baseball; human behavior (aka, baseball players) doesn’t operate on a spreadsheet, and statistics cannot and will not entirely predict all situations in the future.  You can’t just say that the effect doesn’t exist because you can’t prove it exists statistically.  In this case, there’s clearly an analysis/opinion portion of the effect that takes into consideration immeasurable factors that (in Verducci’s opinion) lead to more stress and a higher probability of injury.  Plus, Verducci admits that “body type” and age do factor into his opinion; meaning that a guy with a big body (and by inference he likely means that a bigger body that takes stress off the shoulder) is more likely to be able to weather a larger workload.  Roger Clemens versus Tim Lincecum.  I’d also assume he’s looking at mechanics along the way (and Verducci is on record for being critical of Strasburg’s mechanics, as I discussed in this March 2011 post).  Statistics can’t measure mechanics, or body type, clearly portions of Verducci’s analysis.

Let me put it a different way: would anyone be the slightest bit surprised to see Sale come down with a shoulder injury in 2013?  I certainly would not.  And that’s the essence of the article, to provide a baseball opinion, and one of the reasons I still put stock into it while others waste time trying to disprove it.

Lets just hope Strasburg is one of the 20% he’s wrong about…

Written by Todd Boss

January 25th, 2013 at 10:56 am

Ladson’s inbox 1/22/13

7 comments

Does Boras run the Nats? The national narrative certainly seems to think so. Photo Ezra Shaw/Getty images via espn.com

I love a diversion.  Bill Ladson’s inbox is always a diversion.  Here’s 1/22/13’s edition.

Q: Why do the Nationals need another closer in Rafael Soriano?

A: My posted opinion about the deal from 1/15/13.  Did they “need” another closer?  Probably not.  But, innings sent to Rafael Soriano cascades downwards and means that innings that would be given to lesser relievers will now be pitched by Clippard and Storen (assuming one of them isn’t moved of course), and overall the bullpen is improved.  I wonder if Ted Lerner didn’t pull a George Steinbrenner/Dan Snyder-esque move and force a player signing as a reaction to a singular event (aka Storen’s NLDS game 5 meltdown).  Its possible I suppose.  If so, you hate to see moves like this, because it undermines the GM and leads to poorly constructed rosters.  Ladson belives this is a reactionary move to the NLDS bullpen meltdown in total, not just Storen’s misfortunes.

Q: It seems like Washington takes all of Scott Boras’ clients and puts them on its roster.

A: I hate this Urban Myth that now pervades anyone’s analysis every time the Nats sign a Scott Boras client.  Check the proof: MLBtraderumors keeps a player agent database and guess what?  The Nats don’t even have the most clients of Boras.   The Nats have 7 Boras clients but Boston has 8.  Plus, three of the 7 Boras clients the Nats have were no-brainer 1st round draft picks (Harper, Strasburg and Rendon, and you could even argue a 4th such Boras pick in Goodwin that the team would have taken at that point in the draft irrespective of his representation) that the team was likely going to draft and sign no matter who represented them.  The fact is this: the Nats have become a premier FA destination, Boras represents a lot of good players on the FA, and the Nats have hired some of his players.  When Boston or Texas hires a Boras client, you don’t suddenly hear people sarcastically asking, “Does Boras run the Red Sox?” now do you?  I think its great that Rizzo and Boras have a good working relationship, because other teams/GMs do not, and it affects the quality of their teams as a result.  Ladson defends my point as well, saying similar things to what I’ve pointed out.

Q: Does the Nationals’ front office regret not making Edwin Jackson a qualifying offer? It seems he would have signed elsewhere and the Nats would have received a compensation pick that would help the farm system.

A: Great Question!  One I asked in this space myself on 11/5/12.  I honestly think the team believed that Edwin Jackson, who had a history of signing one year deals, would have taken the contract.  Either that or there was a hand-shake deal in place stating that the team wouldn’t extend the offer.  I don’t truly believe the latter part of this, because (as others have pointed out) it’d be illegal as per the latest CBA.  Either way, I thought it was a mistake at the time and the Nats indeed missed the opportunity to gain an extra pick.  Ladson believes point #1; he thinks the team was afraid that Jackson would take the deal.

Q: If there was one thing that could hold the Nationals back from winning the World Series this year, what would it be?

A: I’ll give you two things that could prevent the team from winning.  1) Injuries in our Rotation and 2) bad luck.  We’re very thin in terms of starters and a season-ending injury to one of our big names would be a bad impediment.  And, the playoffs are crap-shoots; 83 win teams (St. Louis in 2006) can get hot and win it all while 116 win teams (Seattle in 2001) get beat easily before ever getting to the World Series.   That being said, even a starter injury probably wouldn’t be fatal to this team’s chances of making the playoffs; the Mets and Marlins are moving backwards, the Braves seem to be treading water, and the Phillies are getting older by the day.  The division is there for the taking even without winning 98 games again.  Ladson says injuries.

Q: Is it true that the Nationals are interested in Kyle Lohse and plan to put Ross Detwiler in the bullpen?

A: Man, I hope not.  I like Kyle Lohse but there’s a reason he’s still on the FA market despite a TON of teams needing pitching help (and it isn’t just because of the lost draft pick).  He’s really not THAT good.  He had (easily) his best season last year, the definition of a contract year if there ever was one.  Career 98 ERA+.  I think he’s a good fit for a team that needs a 3rd starter, but the Nats aren’t that team.  I made my arguments for keeping Ross Detwiler in the rotation on 1/16/13, when rumors swirled about the team looking at Javier Vazquez.  Who would you rather roll the dice with?  A young, up and coming power lefty or a soft-tossing righty who’ll be 34 next year?  I think buying another $12M/year starter and pushing Detwiler to the bullpen just for the reason of “needing another lefty” in the bullpen is arbitrary and would be a waste of Detwiler’s promising 2012.  Ladson agrees, saying that Davey Johnson likes Detwiler in the rotation.

Q: Would Mark DeRosa be a viable managerial candidate for the Nationals in 2014?

A: Random question.  What makes you think Mark DeRosa won’t still be playing in 2014?  Plus, what ties does he have to this organization that would make you think that the Nats think he’s the heir apparent?  I mean, if we’re talking about former players who have put in the time with this organization, look no further than Matt LeCroy, who played for the team and has been managing in our minor league system for years.  Personally, I think the team will go with a “celebrity manager” when the time comes.  Ladson expresses some surprise at the question as well.

Q: After he was acquired from the Athletics for Michael Morse, where does A.J. Cole fall on the Nationals’ list of prospects?

A: I’d say he’s probably 3rd in line, after Rendon and Goodwin.  That’s about where he was when he was still in the system, and despite his rough 2012 in the California league he’s still very promising.  Ladson says 3rd, as does mlb.com’s rankings for the team.

Q: What did you think of what the Nationals received for Morse? Could they have gotten more — a Major League lefty reliever in addition to a starting prospect? Is the problem that Morse only had a total of two good seasons?

A: I think the Nats got what they could for Morse, frankly.  I would have liked to have seen a MLB lefty and a starting pitcher prospect in the lower-to mid minors.  Lots of people were using the Josh Willingham trade as a comp; both players are similar (both are good offense, no defense type guys in the last year of an affordable contract).  Willingham netted us a mlb reliever and a high-minors OF prospect.  However Morse’s defensive inabilities preceed him reputationally, and many scouts perceive his 2011 as a one-off instead of a ceiling of potential.  Ladson says they made a great deal.

Updated Nats Resource Links and their impact

11 comments

With the slew of off-season activity nearly complete, I’ve updated some of the tracking worksheets that I maintain related to the Nats roster.  From non-tenders, FA signings and re-signings, trades and Arbitration settlements a lot has changed in terms of the Nats payroll, expected WAR estimates and 40-man options statuses.  All these resources are now updated in Google Docs.  Links (which should also be along the right-hand side of the page):

Here’s the implications that the last few months have had in each case:

Nats WAR Estimate Impact: We last visited this topic on 1/3/13 and I had a 2013 fWAR best case estimate of 57.6, equating to a 103 win season.  Now we’ve replaced Michael Morse‘s 3-win estimate with Adam LaRoche‘s 3.5 win estimate and added in Rafael Soriano‘s 1.2 fWAR estimate and are looking at a fWAR estimate of 59.1 and a 105 win capable team.  As with before, this doesn’t mean i’m predicting 105 wins; i’m saying that if everyone plays to their potential and nobody gets hurt, its hard not to see this being a 105 win team as constructed.

Nats 2013 Payroll Impact: When we last visited this topic on 12/3/12, we were sitting on a 2013 estimated payroll of just $88M.  Since then, we re-signed LaRoche, signed Dan Haren, stunningly signed Soriano and settled a slew of pre-arbitration settlements (most of which seemed to trend higher than MLB’s estimates for the players).  I’m now estimating the Nats 2013 payroll to be $121,823,500 (but see the caveat in the next paragraph).  There are still two payroll figures to be announced/decided: Zach Duke‘s 2013 pay has yet to be disclosed (I’m using an estimate of $1.5M) and Jordan Zimmermann was not able to settle with the team ahead of the filing deadline (i’m using an estimate of $4.9M for him).  The team filed at $4.6M while Zimmermann filed at $5.8M, meaning they’re $1.2M apart at current.  The midpoint would be $5.2M, meaning that the overall payroll could creep even higher and hit $122M.

Coincidentally, I’m not sure how to treat Soriano’s deal from a payroll perspective.  2 years, $28M but as we’ve learned half that money is deferred.  The spreadsheet shows it as a $14M aav contract but he’s only being paid $7M this year.  With the deferred money, the calculated AAV of the contract is only in the $11M/year range.  Cots shows $14M/year right now on its main page, but it hasn’t fixed its internal google XLS’s yet.  I think the right way to go would be to show $7M being paid this year and next, and then when the deferred payments kick in show them as the annual $2M payments that they’ll be.  So maybe the current payroll isn’t $121M but closer to $114M.  I’ll be curious to see how the sites like Cots and Usatoday (the two main sites that publish team payroll figures) treat this contract going forward.

Option Status: We last visited this topic on 11/14/12, before the non-tenders of Flores, Lannan and Gorzelanny, before the Rule-5 additions and before all the signings.   New signings Haren and Soriano are both 5+ year vets so Options don’t matter.  Interestingly, Duke has 6+ years of service time and signed a MLB deal, meaning he cannot be assigned to AAA withouth is consent and/or passing through waivers; the team is clearly counting on him to be in the MLB bullpen the whole year.  The most interesting options cases now belong to Ryan Mattheus and Craig Stammen, both of whom have options and both of whom (despite Stammen’s new 2 year deal) could be affected by the crowded bullpen.  I think we’re all under the assumption that Christian Garcia is starting the year in AAA; he has 3 options to use and may be on the train back and forth often in 2013.  I remain curious as to what the team will do with Carlos Rivero, who hit well in AAA and even better in winter ball, but has no options remaining and doesn’t have a single day of MLB service time.

Lastly (unrelated to the Nats), I’ve updated somewhat my “Best versus Winner” xls with the results from the NFL playoffs over the weekend.  For the 9th straight year in the NFL, the Superbowl winner will NOT be the team that also had the best regular season record.  This year, Denver and Atlanta shared the best regular season record and both were eliminated before reaching the Superbowl.  I keep track of this particular finding for all four major sports and generally have found that very infrequently does the team with the best record in any sport actually take the year end title any more.  Baseball has only seen it a few times in the last 20 years.

I’ve got a draft post that has an overview of all the random documents and spreadsheets that I’ve uploaded to Google Docs over the years (including the 4 discussed in this post).  I”ll publish it during a slow period this winter.